Cherokee vs Immigrants from Burma/Myanmar Currently Married
COMPARE
Cherokee
Immigrants from Burma/Myanmar
Currently Married
Currently Married Comparison
Cherokee
Immigrants from Burma/Myanmar
46.9%
CURRENTLY MARRIED
66.8/ 100
METRIC RATING
158th/ 347
METRIC RANK
44.3%
CURRENTLY MARRIED
0.4/ 100
METRIC RATING
246th/ 347
METRIC RANK
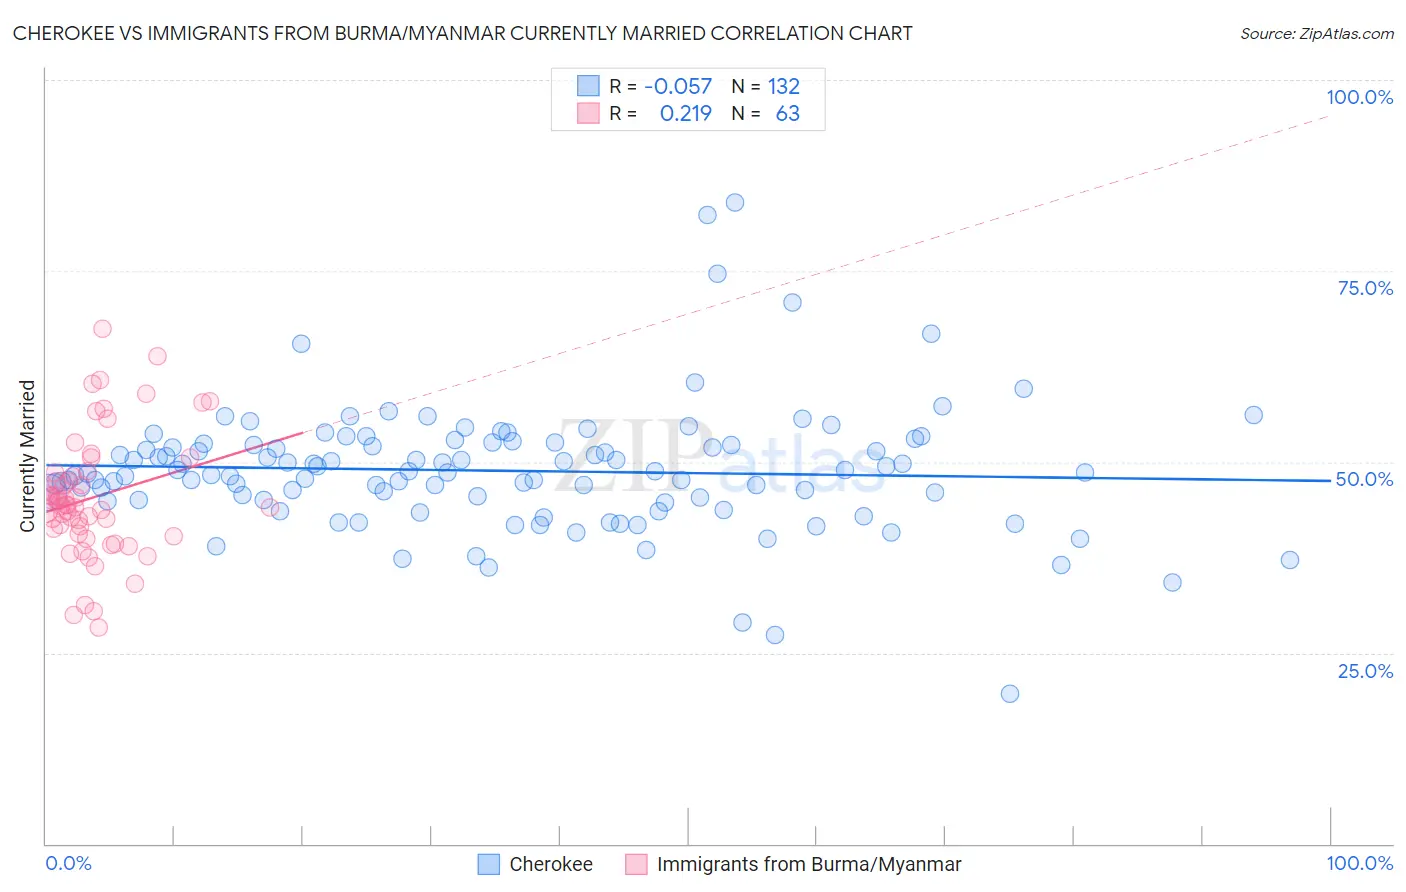
Cherokee vs Immigrants from Burma/Myanmar Currently Married Correlation Chart
The statistical analysis conducted on geographies consisting of 493,651,185 people shows a slight negative correlation between the proportion of Cherokee and percentage of population currently married in the United States with a correlation coefficient (R) of -0.057 and weighted average of 46.9%. Similarly, the statistical analysis conducted on geographies consisting of 172,355,169 people shows a weak positive correlation between the proportion of Immigrants from Burma/Myanmar and percentage of population currently married in the United States with a correlation coefficient (R) of 0.219 and weighted average of 44.3%, a difference of 5.9%.
Currently Married Correlation Summary
| Measurement | Cherokee | Immigrants from Burma/Myanmar |
| Minimum | 19.6% | 28.3% |
| Maximum | 84.0% | 67.5% |
| Range | 64.4% | 39.2% |
| Mean | 48.8% | 45.3% |
| Median | 48.6% | 44.3% |
| Interquartile 25% (IQ1) | 45.0% | 40.6% |
| Interquartile 75% (IQ3) | 52.3% | 48.7% |
| Interquartile Range (IQR) | 7.4% | 8.0% |
| Standard Deviation (Sample) | 8.4% | 8.1% |
| Standard Deviation (Population) | 8.4% | 8.0% |
Similar Demographics by Currently Married
Demographics Similar to Cherokee by Currently Married
In terms of currently married, the demographic groups most similar to Cherokee are Iraqi (46.9%, a difference of 0.020%), Immigrants from Uzbekistan (46.9%, a difference of 0.030%), Immigrants from Southern Europe (46.9%, a difference of 0.030%), Immigrants from Switzerland (46.9%, a difference of 0.040%), and Spanish (47.0%, a difference of 0.050%).
| Demographics | Rating | Rank | Currently Married |
| Chileans | 69.8 /100 | #151 | Good 47.0% |
| Immigrants | Serbia | 68.8 /100 | #152 | Good 47.0% |
| Immigrants | Venezuela | 68.6 /100 | #153 | Good 47.0% |
| Albanians | 68.6 /100 | #154 | Good 47.0% |
| Arabs | 68.6 /100 | #155 | Good 47.0% |
| Spanish | 68.1 /100 | #156 | Good 47.0% |
| Immigrants | Switzerland | 67.8 /100 | #157 | Good 46.9% |
| Cherokee | 66.8 /100 | #158 | Good 46.9% |
| Iraqis | 66.4 /100 | #159 | Good 46.9% |
| Immigrants | Uzbekistan | 66.0 /100 | #160 | Good 46.9% |
| Immigrants | Southern Europe | 65.9 /100 | #161 | Good 46.9% |
| Immigrants | Nonimmigrants | 65.4 /100 | #162 | Good 46.9% |
| Delaware | 64.7 /100 | #163 | Good 46.9% |
| Immigrants | Western Asia | 64.2 /100 | #164 | Good 46.9% |
| Samoans | 59.8 /100 | #165 | Average 46.8% |
Demographics Similar to Immigrants from Burma/Myanmar by Currently Married
In terms of currently married, the demographic groups most similar to Immigrants from Burma/Myanmar are Immigrants from Armenia (44.3%, a difference of 0.070%), Ugandan (44.2%, a difference of 0.13%), Nicaraguan (44.2%, a difference of 0.22%), Immigrants from Cameroon (44.2%, a difference of 0.24%), and Immigrants from Eastern Africa (44.2%, a difference of 0.26%).
| Demographics | Rating | Rank | Currently Married |
| Immigrants | Mexico | 0.7 /100 | #239 | Tragic 44.5% |
| Mexican American Indians | 0.7 /100 | #240 | Tragic 44.5% |
| Ethiopians | 0.7 /100 | #241 | Tragic 44.5% |
| Immigrants | Cambodia | 0.7 /100 | #242 | Tragic 44.5% |
| Immigrants | Ethiopia | 0.7 /100 | #243 | Tragic 44.5% |
| Japanese | 0.6 /100 | #244 | Tragic 44.5% |
| Immigrants | Armenia | 0.4 /100 | #245 | Tragic 44.3% |
| Immigrants | Burma/Myanmar | 0.4 /100 | #246 | Tragic 44.3% |
| Ugandans | 0.4 /100 | #247 | Tragic 44.2% |
| Nicaraguans | 0.3 /100 | #248 | Tragic 44.2% |
| Immigrants | Cameroon | 0.3 /100 | #249 | Tragic 44.2% |
| Immigrants | Eastern Africa | 0.3 /100 | #250 | Tragic 44.2% |
| Blackfeet | 0.3 /100 | #251 | Tragic 44.2% |
| Hispanics or Latinos | 0.3 /100 | #252 | Tragic 44.1% |
| Immigrants | Central America | 0.3 /100 | #253 | Tragic 44.1% |