Cherokee vs Immigrants from Burma/Myanmar Disability Age 65 to 74
COMPARE
Cherokee
Immigrants from Burma/Myanmar
Disability Age 65 to 74
Disability Age 65 to 74 Comparison
Cherokee
Immigrants from Burma/Myanmar
28.2%
DISABILITY AGE 65 TO 74
0.0/ 100
METRIC RATING
320th/ 347
METRIC RANK
24.0%
DISABILITY AGE 65 TO 74
11.6/ 100
METRIC RATING
219th/ 347
METRIC RANK
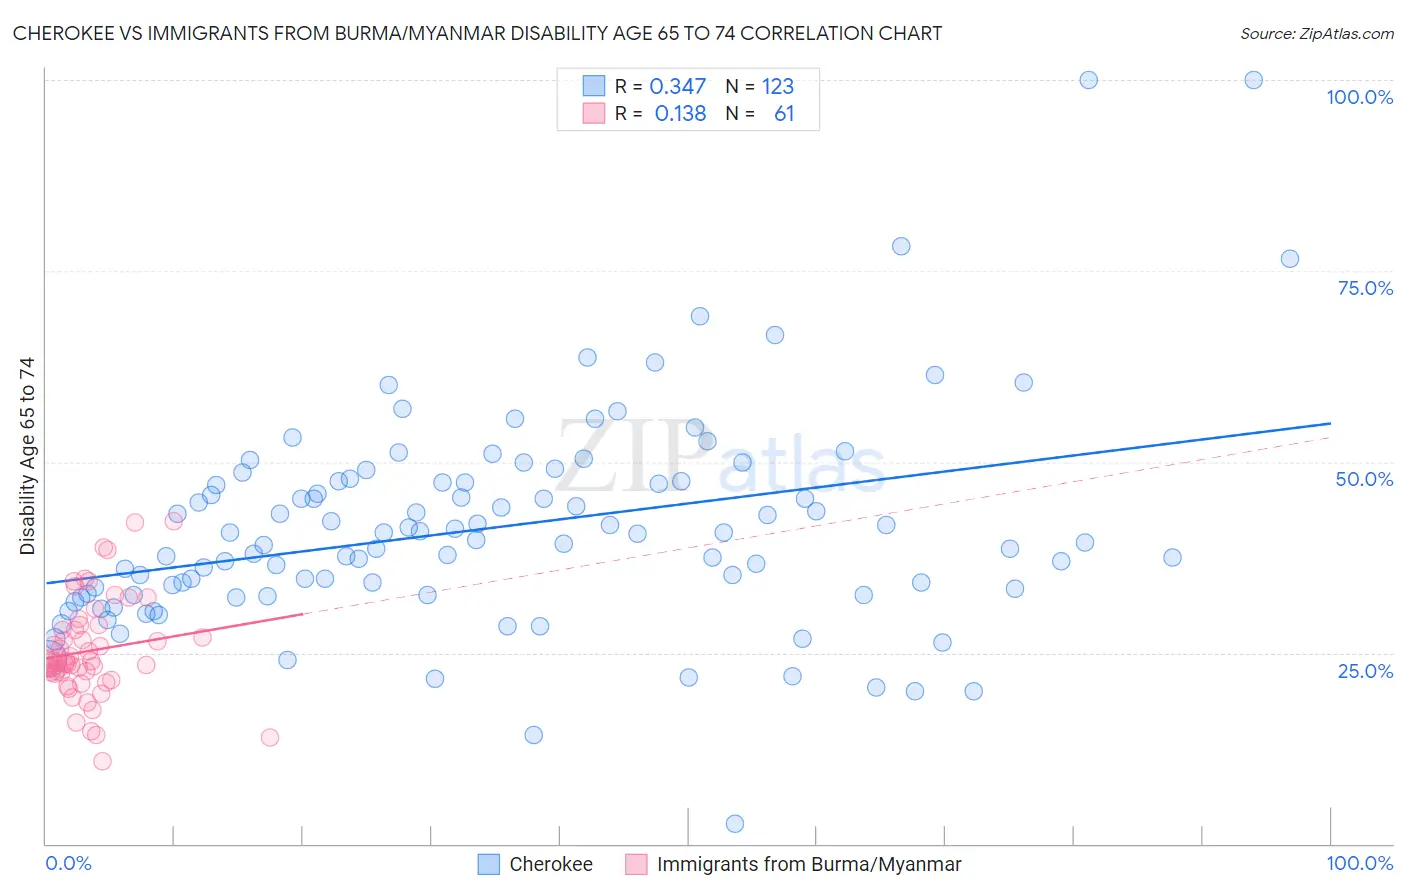
Cherokee vs Immigrants from Burma/Myanmar Disability Age 65 to 74 Correlation Chart
The statistical analysis conducted on geographies consisting of 492,470,212 people shows a mild positive correlation between the proportion of Cherokee and percentage of population with a disability between the ages 65 and 75 in the United States with a correlation coefficient (R) of 0.347 and weighted average of 28.2%. Similarly, the statistical analysis conducted on geographies consisting of 172,172,101 people shows a poor positive correlation between the proportion of Immigrants from Burma/Myanmar and percentage of population with a disability between the ages 65 and 75 in the United States with a correlation coefficient (R) of 0.138 and weighted average of 24.0%, a difference of 17.4%.
Disability Age 65 to 74 Correlation Summary
| Measurement | Cherokee | Immigrants from Burma/Myanmar |
| Minimum | 2.6% | 10.8% |
| Maximum | 100.0% | 42.1% |
| Range | 97.4% | 31.3% |
| Mean | 41.4% | 25.3% |
| Median | 39.7% | 23.9% |
| Interquartile 25% (IQ1) | 32.6% | 22.3% |
| Interquartile 75% (IQ3) | 47.4% | 28.3% |
| Interquartile Range (IQR) | 14.8% | 6.0% |
| Standard Deviation (Sample) | 14.2% | 6.5% |
| Standard Deviation (Population) | 14.1% | 6.4% |
Similar Demographics by Disability Age 65 to 74
Demographics Similar to Cherokee by Disability Age 65 to 74
In terms of disability age 65 to 74, the demographic groups most similar to Cherokee are Arapaho (28.1%, a difference of 0.39%), Comanche (28.3%, a difference of 0.51%), Nepalese (28.0%, a difference of 0.62%), Immigrants from Armenia (28.0%, a difference of 0.84%), and Aleut (28.4%, a difference of 0.84%).
| Demographics | Rating | Rank | Disability Age 65 to 74 |
| Paiute | 0.0 /100 | #313 | Tragic 27.8% |
| Chippewa | 0.0 /100 | #314 | Tragic 27.8% |
| Cajuns | 0.0 /100 | #315 | Tragic 27.9% |
| Crow | 0.0 /100 | #316 | Tragic 27.9% |
| Immigrants | Armenia | 0.0 /100 | #317 | Tragic 28.0% |
| Nepalese | 0.0 /100 | #318 | Tragic 28.0% |
| Arapaho | 0.0 /100 | #319 | Tragic 28.1% |
| Cherokee | 0.0 /100 | #320 | Tragic 28.2% |
| Comanche | 0.0 /100 | #321 | Tragic 28.3% |
| Aleuts | 0.0 /100 | #322 | Tragic 28.4% |
| Puerto Ricans | 0.0 /100 | #323 | Tragic 29.1% |
| Seminole | 0.0 /100 | #324 | Tragic 29.4% |
| Dutch West Indians | 0.0 /100 | #325 | Tragic 29.6% |
| Yakama | 0.0 /100 | #326 | Tragic 29.6% |
| Apache | 0.0 /100 | #327 | Tragic 29.7% |
Demographics Similar to Immigrants from Burma/Myanmar by Disability Age 65 to 74
In terms of disability age 65 to 74, the demographic groups most similar to Immigrants from Burma/Myanmar are Immigrants from Portugal (24.0%, a difference of 0.020%), Immigrants from Nigeria (24.0%, a difference of 0.020%), Jamaican (24.0%, a difference of 0.090%), Ghanaian (24.1%, a difference of 0.18%), and Pennsylvania German (24.0%, a difference of 0.22%).
| Demographics | Rating | Rank | Disability Age 65 to 74 |
| French | 15.7 /100 | #212 | Poor 23.9% |
| Nicaraguans | 14.3 /100 | #213 | Poor 23.9% |
| Immigrants | Oceania | 13.6 /100 | #214 | Poor 24.0% |
| Pennsylvania Germans | 13.3 /100 | #215 | Poor 24.0% |
| Jamaicans | 12.2 /100 | #216 | Poor 24.0% |
| Immigrants | Portugal | 11.7 /100 | #217 | Poor 24.0% |
| Immigrants | Nigeria | 11.7 /100 | #218 | Poor 24.0% |
| Immigrants | Burma/Myanmar | 11.6 /100 | #219 | Poor 24.0% |
| Ghanaians | 10.4 /100 | #220 | Poor 24.1% |
| Immigrants | Nicaragua | 9.8 /100 | #221 | Tragic 24.1% |
| Native Hawaiians | 9.3 /100 | #222 | Tragic 24.1% |
| Immigrants | Middle Africa | 8.9 /100 | #223 | Tragic 24.1% |
| Immigrants | Panama | 8.6 /100 | #224 | Tragic 24.1% |
| Bermudans | 8.2 /100 | #225 | Tragic 24.2% |
| Iraqis | 8.1 /100 | #226 | Tragic 24.2% |