Cherokee vs Immigrants from Burma/Myanmar Child Poverty Among Boys Under 16
COMPARE
Cherokee
Immigrants from Burma/Myanmar
Child Poverty Among Boys Under 16
Child Poverty Among Boys Under 16 Comparison
Cherokee
Immigrants from Burma/Myanmar
19.7%
CHILD POVERTY AMONG BOYS UNDER 16
0.1/ 100
METRIC RATING
270th/ 347
METRIC RANK
19.2%
CHILD POVERTY AMONG BOYS UNDER 16
0.2/ 100
METRIC RATING
250th/ 347
METRIC RANK
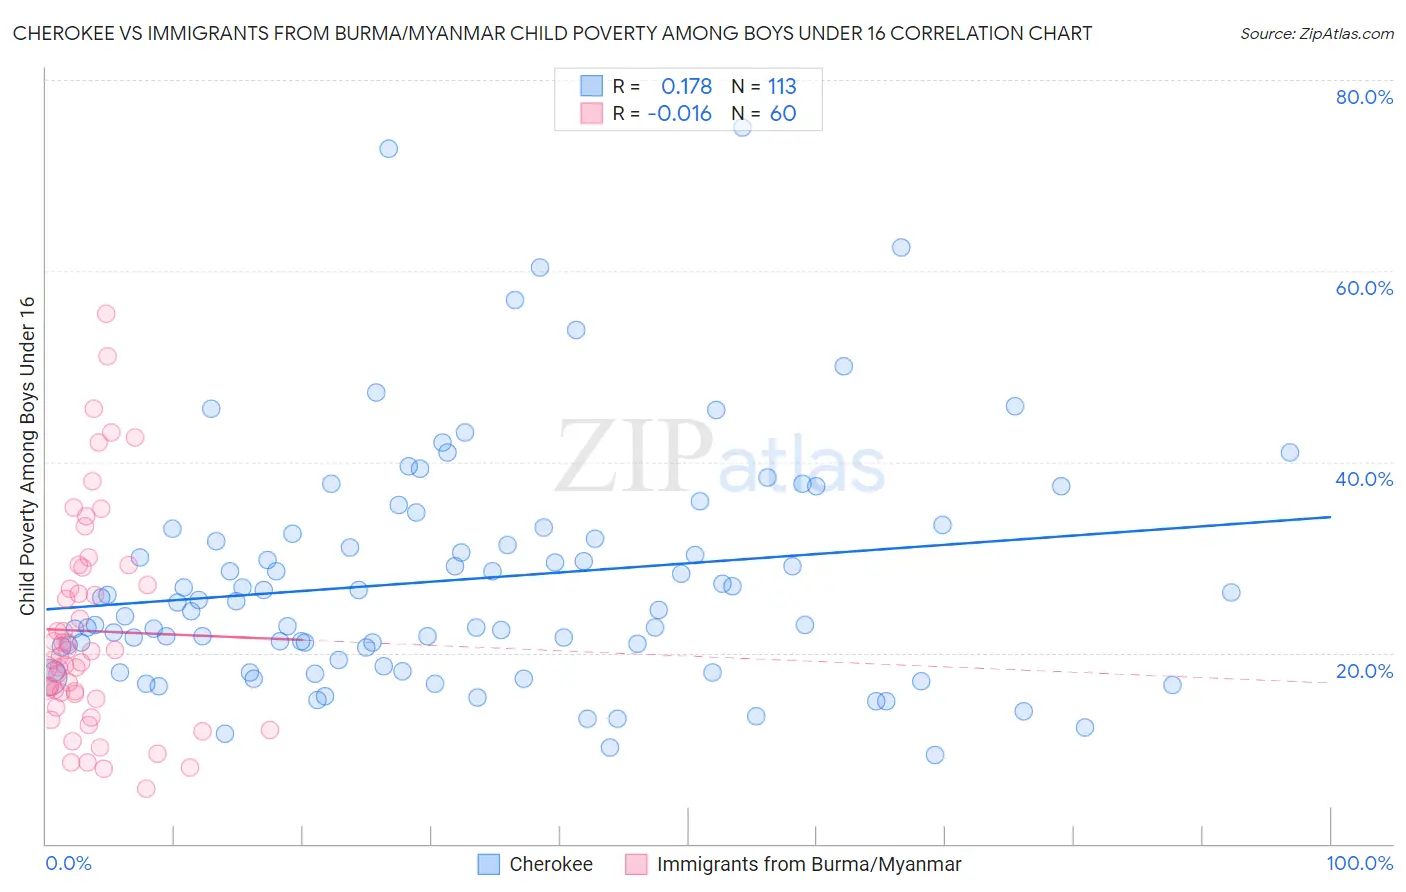
Cherokee vs Immigrants from Burma/Myanmar Child Poverty Among Boys Under 16 Correlation Chart
The statistical analysis conducted on geographies consisting of 484,106,985 people shows a poor positive correlation between the proportion of Cherokee and poverty level among boys under the age of 16 in the United States with a correlation coefficient (R) of 0.178 and weighted average of 19.7%. Similarly, the statistical analysis conducted on geographies consisting of 171,312,053 people shows no correlation between the proportion of Immigrants from Burma/Myanmar and poverty level among boys under the age of 16 in the United States with a correlation coefficient (R) of -0.016 and weighted average of 19.2%, a difference of 2.6%.
Child Poverty Among Boys Under 16 Correlation Summary
| Measurement | Cherokee | Immigrants from Burma/Myanmar |
| Minimum | 9.3% | 5.8% |
| Maximum | 75.0% | 55.6% |
| Range | 65.7% | 49.8% |
| Mean | 27.7% | 22.3% |
| Median | 25.3% | 19.5% |
| Interquartile 25% (IQ1) | 19.0% | 15.4% |
| Interquartile 75% (IQ3) | 32.7% | 28.0% |
| Interquartile Range (IQR) | 13.8% | 12.6% |
| Standard Deviation (Sample) | 12.4% | 11.2% |
| Standard Deviation (Population) | 12.3% | 11.1% |
Demographics Similar to Cherokee and Immigrants from Burma/Myanmar by Child Poverty Among Boys Under 16
In terms of child poverty among boys under 16, the demographic groups most similar to Cherokee are Immigrants from Cabo Verde (19.7%, a difference of 0.28%), Spanish American Indian (19.6%, a difference of 0.44%), Vietnamese (19.6%, a difference of 0.55%), Immigrants from El Salvador (19.6%, a difference of 0.57%), and Guyanese (19.6%, a difference of 0.61%). Similarly, the demographic groups most similar to Immigrants from Burma/Myanmar are French American Indian (19.2%, a difference of 0.030%), Immigrants from Western Africa (19.3%, a difference of 0.26%), Liberian (19.3%, a difference of 0.33%), Trinidadian and Tobagonian (19.3%, a difference of 0.60%), and Ecuadorian (19.3%, a difference of 0.60%).
| Demographics | Rating | Rank | Child Poverty Among Boys Under 16 |
| Immigrants | Burma/Myanmar | 0.2 /100 | #250 | Tragic 19.2% |
| French American Indians | 0.2 /100 | #251 | Tragic 19.2% |
| Immigrants | Western Africa | 0.2 /100 | #252 | Tragic 19.3% |
| Liberians | 0.2 /100 | #253 | Tragic 19.3% |
| Trinidadians and Tobagonians | 0.2 /100 | #254 | Tragic 19.3% |
| Ecuadorians | 0.2 /100 | #255 | Tragic 19.3% |
| Immigrants | Liberia | 0.2 /100 | #256 | Tragic 19.3% |
| Mexican American Indians | 0.2 /100 | #257 | Tragic 19.4% |
| Potawatomi | 0.2 /100 | #258 | Tragic 19.4% |
| Spanish Americans | 0.2 /100 | #259 | Tragic 19.4% |
| Shoshone | 0.2 /100 | #260 | Tragic 19.4% |
| Immigrants | Ghana | 0.2 /100 | #261 | Tragic 19.4% |
| Immigrants | Guyana | 0.1 /100 | #262 | Tragic 19.5% |
| Ottawa | 0.1 /100 | #263 | Tragic 19.5% |
| Iroquois | 0.1 /100 | #264 | Tragic 19.6% |
| Guyanese | 0.1 /100 | #265 | Tragic 19.6% |
| Immigrants | El Salvador | 0.1 /100 | #266 | Tragic 19.6% |
| Vietnamese | 0.1 /100 | #267 | Tragic 19.6% |
| Spanish American Indians | 0.1 /100 | #268 | Tragic 19.6% |
| Immigrants | Cabo Verde | 0.1 /100 | #269 | Tragic 19.7% |
| Cherokee | 0.1 /100 | #270 | Tragic 19.7% |