Arapaho vs Immigrants from Burma/Myanmar Currently Married
COMPARE
Arapaho
Immigrants from Burma/Myanmar
Currently Married
Currently Married Comparison
Arapaho
Immigrants from Burma/Myanmar
40.5%
CURRENTLY MARRIED
0.0/ 100
METRIC RATING
328th/ 347
METRIC RANK
44.3%
CURRENTLY MARRIED
0.4/ 100
METRIC RATING
246th/ 347
METRIC RANK
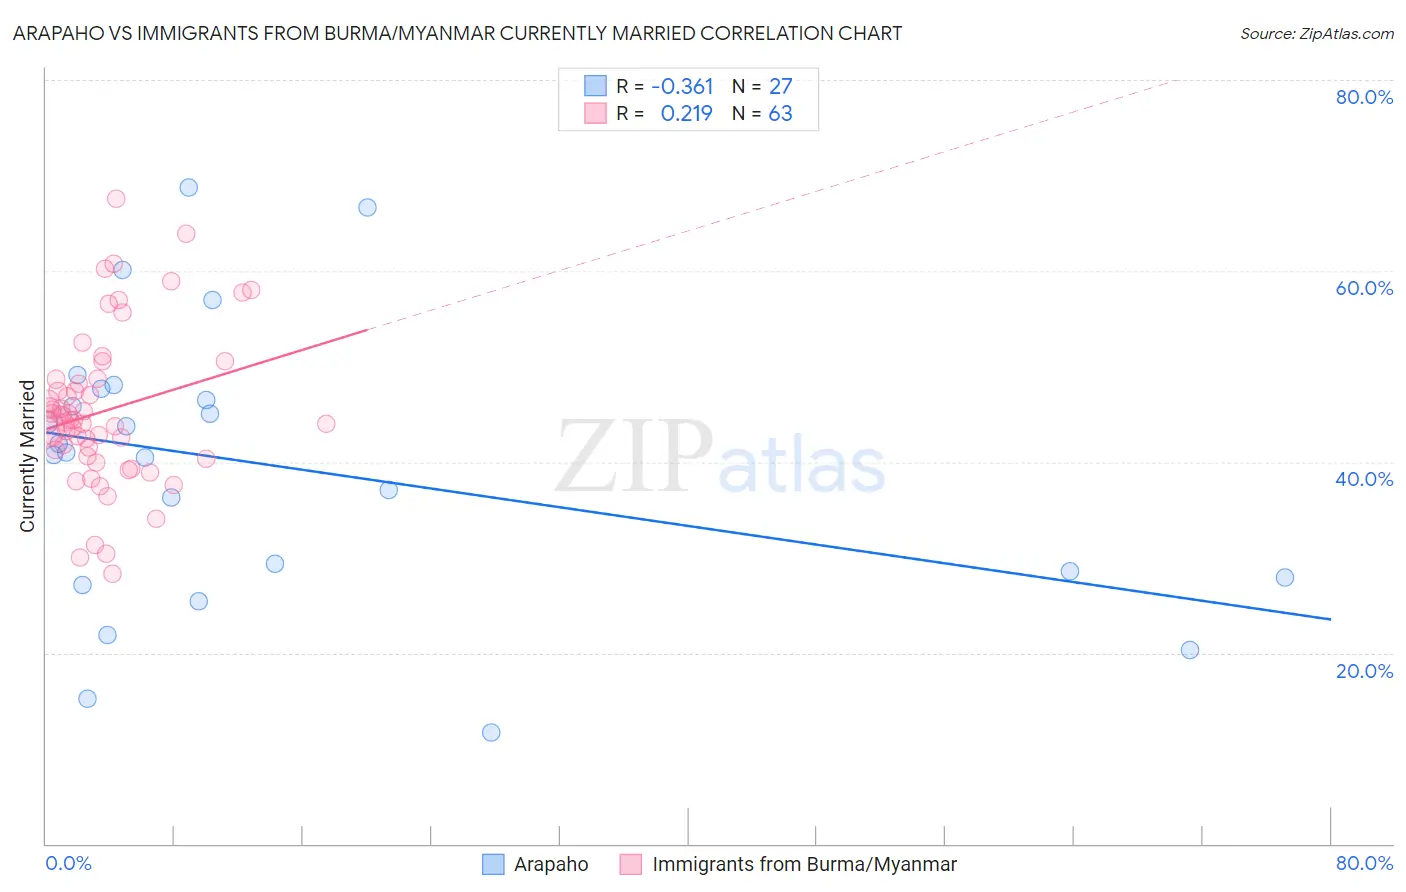
Arapaho vs Immigrants from Burma/Myanmar Currently Married Correlation Chart
The statistical analysis conducted on geographies consisting of 29,779,567 people shows a mild negative correlation between the proportion of Arapaho and percentage of population currently married in the United States with a correlation coefficient (R) of -0.361 and weighted average of 40.5%. Similarly, the statistical analysis conducted on geographies consisting of 172,355,169 people shows a weak positive correlation between the proportion of Immigrants from Burma/Myanmar and percentage of population currently married in the United States with a correlation coefficient (R) of 0.219 and weighted average of 44.3%, a difference of 9.3%.
Currently Married Correlation Summary
| Measurement | Arapaho | Immigrants from Burma/Myanmar |
| Minimum | 11.7% | 28.3% |
| Maximum | 68.7% | 67.5% |
| Range | 57.0% | 39.2% |
| Mean | 39.5% | 45.3% |
| Median | 41.0% | 44.3% |
| Interquartile 25% (IQ1) | 27.9% | 40.6% |
| Interquartile 75% (IQ3) | 47.6% | 48.7% |
| Interquartile Range (IQR) | 19.7% | 8.0% |
| Standard Deviation (Sample) | 14.5% | 8.1% |
| Standard Deviation (Population) | 14.3% | 8.0% |
Similar Demographics by Currently Married
Demographics Similar to Arapaho by Currently Married
In terms of currently married, the demographic groups most similar to Arapaho are Senegalese (40.6%, a difference of 0.040%), Barbadian (40.6%, a difference of 0.22%), U.S. Virgin Islander (40.7%, a difference of 0.35%), Immigrants from Senegal (40.7%, a difference of 0.40%), and Immigrants from West Indies (40.7%, a difference of 0.41%).
| Demographics | Rating | Rank | Currently Married |
| Immigrants | Congo | 0.0 /100 | #321 | Tragic 41.1% |
| Immigrants | Haiti | 0.0 /100 | #322 | Tragic 41.0% |
| Immigrants | West Indies | 0.0 /100 | #323 | Tragic 40.7% |
| Immigrants | Senegal | 0.0 /100 | #324 | Tragic 40.7% |
| U.S. Virgin Islanders | 0.0 /100 | #325 | Tragic 40.7% |
| Barbadians | 0.0 /100 | #326 | Tragic 40.6% |
| Senegalese | 0.0 /100 | #327 | Tragic 40.6% |
| Arapaho | 0.0 /100 | #328 | Tragic 40.5% |
| Crow | 0.0 /100 | #329 | Tragic 40.4% |
| Immigrants | Dominica | 0.0 /100 | #330 | Tragic 40.3% |
| Immigrants | Barbados | 0.0 /100 | #331 | Tragic 40.3% |
| Immigrants | St. Vincent and the Grenadines | 0.0 /100 | #332 | Tragic 40.1% |
| Yup'ik | 0.0 /100 | #333 | Tragic 39.9% |
| Puerto Ricans | 0.0 /100 | #334 | Tragic 39.9% |
| Lumbee | 0.0 /100 | #335 | Tragic 39.8% |
Demographics Similar to Immigrants from Burma/Myanmar by Currently Married
In terms of currently married, the demographic groups most similar to Immigrants from Burma/Myanmar are Immigrants from Armenia (44.3%, a difference of 0.070%), Ugandan (44.2%, a difference of 0.13%), Nicaraguan (44.2%, a difference of 0.22%), Immigrants from Cameroon (44.2%, a difference of 0.24%), and Immigrants from Eastern Africa (44.2%, a difference of 0.26%).
| Demographics | Rating | Rank | Currently Married |
| Immigrants | Mexico | 0.7 /100 | #239 | Tragic 44.5% |
| Mexican American Indians | 0.7 /100 | #240 | Tragic 44.5% |
| Ethiopians | 0.7 /100 | #241 | Tragic 44.5% |
| Immigrants | Cambodia | 0.7 /100 | #242 | Tragic 44.5% |
| Immigrants | Ethiopia | 0.7 /100 | #243 | Tragic 44.5% |
| Japanese | 0.6 /100 | #244 | Tragic 44.5% |
| Immigrants | Armenia | 0.4 /100 | #245 | Tragic 44.3% |
| Immigrants | Burma/Myanmar | 0.4 /100 | #246 | Tragic 44.3% |
| Ugandans | 0.4 /100 | #247 | Tragic 44.2% |
| Nicaraguans | 0.3 /100 | #248 | Tragic 44.2% |
| Immigrants | Cameroon | 0.3 /100 | #249 | Tragic 44.2% |
| Immigrants | Eastern Africa | 0.3 /100 | #250 | Tragic 44.2% |
| Blackfeet | 0.3 /100 | #251 | Tragic 44.2% |
| Hispanics or Latinos | 0.3 /100 | #252 | Tragic 44.1% |
| Immigrants | Central America | 0.3 /100 | #253 | Tragic 44.1% |