Assyrian/Chaldean/Syriac vs Immigrants from Burma/Myanmar Currently Married
COMPARE
Assyrian/Chaldean/Syriac
Immigrants from Burma/Myanmar
Currently Married
Currently Married Comparison
Assyrians/Chaldeans/Syriacs
Immigrants from Burma/Myanmar
50.8%
CURRENTLY MARRIED
100.0/ 100
METRIC RATING
3rd/ 347
METRIC RANK
44.3%
CURRENTLY MARRIED
0.4/ 100
METRIC RATING
246th/ 347
METRIC RANK
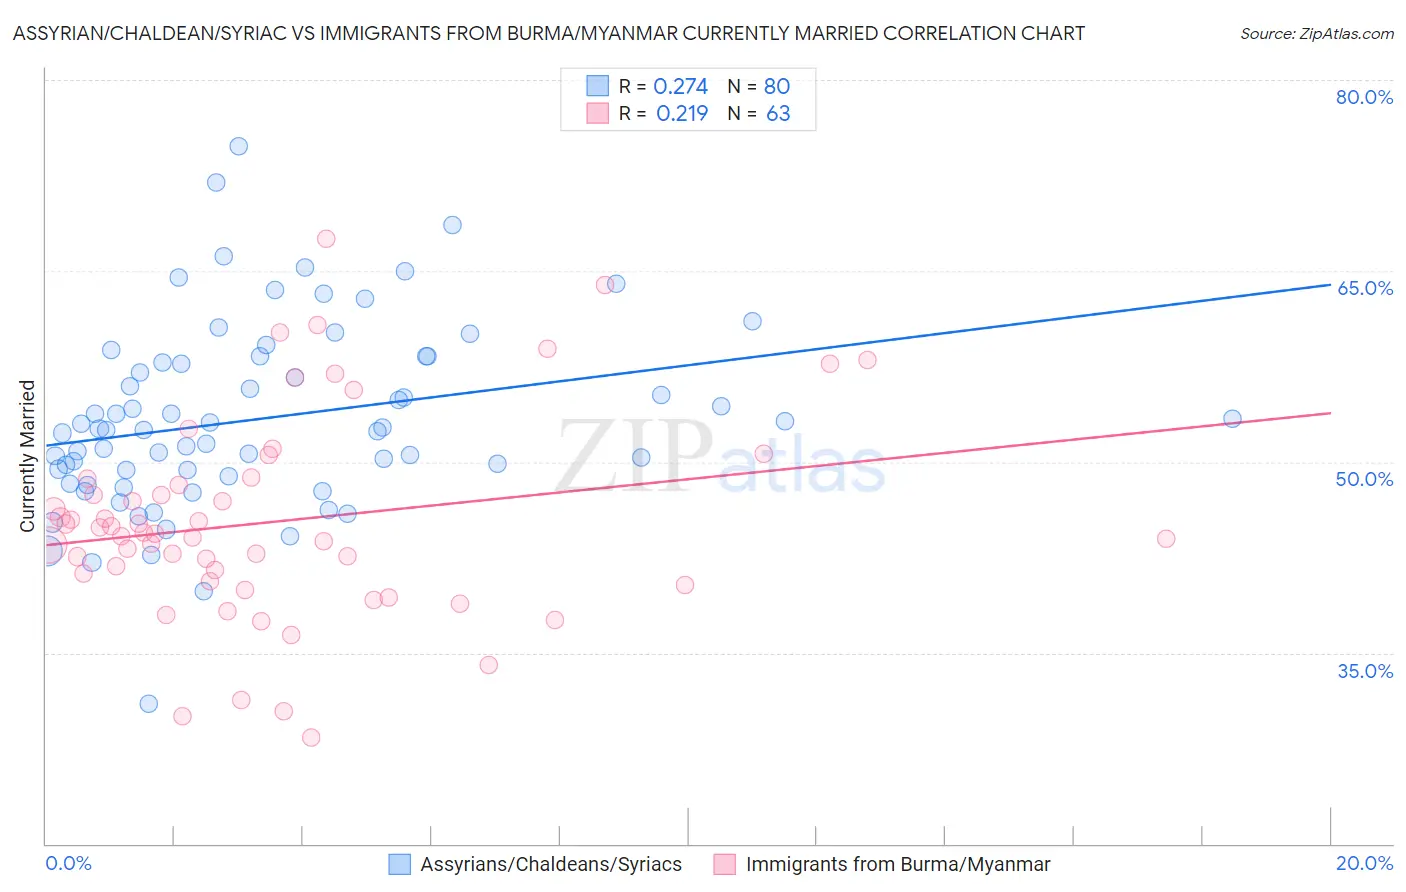
Assyrian/Chaldean/Syriac vs Immigrants from Burma/Myanmar Currently Married Correlation Chart
The statistical analysis conducted on geographies consisting of 110,318,125 people shows a weak positive correlation between the proportion of Assyrians/Chaldeans/Syriacs and percentage of population currently married in the United States with a correlation coefficient (R) of 0.274 and weighted average of 50.8%. Similarly, the statistical analysis conducted on geographies consisting of 172,355,169 people shows a weak positive correlation between the proportion of Immigrants from Burma/Myanmar and percentage of population currently married in the United States with a correlation coefficient (R) of 0.219 and weighted average of 44.3%, a difference of 14.6%.
Currently Married Correlation Summary
| Measurement | Assyrian/Chaldean/Syriac | Immigrants from Burma/Myanmar |
| Minimum | 31.0% | 28.3% |
| Maximum | 74.8% | 67.5% |
| Range | 43.8% | 39.2% |
| Mean | 53.4% | 45.3% |
| Median | 52.6% | 44.3% |
| Interquartile 25% (IQ1) | 49.1% | 40.6% |
| Interquartile 75% (IQ3) | 58.1% | 48.7% |
| Interquartile Range (IQR) | 8.9% | 8.0% |
| Standard Deviation (Sample) | 7.4% | 8.1% |
| Standard Deviation (Population) | 7.3% | 8.0% |
Similar Demographics by Currently Married
Demographics Similar to Assyrians/Chaldeans/Syriacs by Currently Married
In terms of currently married, the demographic groups most similar to Assyrians/Chaldeans/Syriacs are Immigrants from Taiwan (50.7%, a difference of 0.080%), Thai (50.9%, a difference of 0.18%), Danish (50.5%, a difference of 0.63%), Norwegian (50.2%, a difference of 1.2%), and Immigrants from South Central Asia (50.0%, a difference of 1.5%).
| Demographics | Rating | Rank | Currently Married |
| Immigrants | India | 100.0 /100 | #1 | Exceptional 51.8% |
| Thais | 100.0 /100 | #2 | Exceptional 50.9% |
| Assyrians/Chaldeans/Syriacs | 100.0 /100 | #3 | Exceptional 50.8% |
| Immigrants | Taiwan | 100.0 /100 | #4 | Exceptional 50.7% |
| Danes | 100.0 /100 | #5 | Exceptional 50.5% |
| Norwegians | 100.0 /100 | #6 | Exceptional 50.2% |
| Immigrants | South Central Asia | 100.0 /100 | #7 | Exceptional 50.0% |
| Swedes | 100.0 /100 | #8 | Exceptional 50.0% |
| Czechs | 99.9 /100 | #9 | Exceptional 49.9% |
| Filipinos | 99.9 /100 | #10 | Exceptional 49.7% |
| English | 99.9 /100 | #11 | Exceptional 49.7% |
| Swiss | 99.9 /100 | #12 | Exceptional 49.7% |
| Dutch | 99.9 /100 | #13 | Exceptional 49.6% |
| Germans | 99.9 /100 | #14 | Exceptional 49.6% |
| Pennsylvania Germans | 99.9 /100 | #15 | Exceptional 49.6% |
Demographics Similar to Immigrants from Burma/Myanmar by Currently Married
In terms of currently married, the demographic groups most similar to Immigrants from Burma/Myanmar are Immigrants from Armenia (44.3%, a difference of 0.070%), Ugandan (44.2%, a difference of 0.13%), Nicaraguan (44.2%, a difference of 0.22%), Immigrants from Cameroon (44.2%, a difference of 0.24%), and Immigrants from Eastern Africa (44.2%, a difference of 0.26%).
| Demographics | Rating | Rank | Currently Married |
| Immigrants | Mexico | 0.7 /100 | #239 | Tragic 44.5% |
| Mexican American Indians | 0.7 /100 | #240 | Tragic 44.5% |
| Ethiopians | 0.7 /100 | #241 | Tragic 44.5% |
| Immigrants | Cambodia | 0.7 /100 | #242 | Tragic 44.5% |
| Immigrants | Ethiopia | 0.7 /100 | #243 | Tragic 44.5% |
| Japanese | 0.6 /100 | #244 | Tragic 44.5% |
| Immigrants | Armenia | 0.4 /100 | #245 | Tragic 44.3% |
| Immigrants | Burma/Myanmar | 0.4 /100 | #246 | Tragic 44.3% |
| Ugandans | 0.4 /100 | #247 | Tragic 44.2% |
| Nicaraguans | 0.3 /100 | #248 | Tragic 44.2% |
| Immigrants | Cameroon | 0.3 /100 | #249 | Tragic 44.2% |
| Immigrants | Eastern Africa | 0.3 /100 | #250 | Tragic 44.2% |
| Blackfeet | 0.3 /100 | #251 | Tragic 44.2% |
| Hispanics or Latinos | 0.3 /100 | #252 | Tragic 44.1% |
| Immigrants | Central America | 0.3 /100 | #253 | Tragic 44.1% |