Cherokee vs Immigrants from Panama Currently Married
COMPARE
Cherokee
Immigrants from Panama
Currently Married
Currently Married Comparison
Cherokee
Immigrants from Panama
46.9%
CURRENTLY MARRIED
66.8/ 100
METRIC RATING
158th/ 347
METRIC RANK
44.9%
CURRENTLY MARRIED
1.5/ 100
METRIC RATING
231st/ 347
METRIC RANK
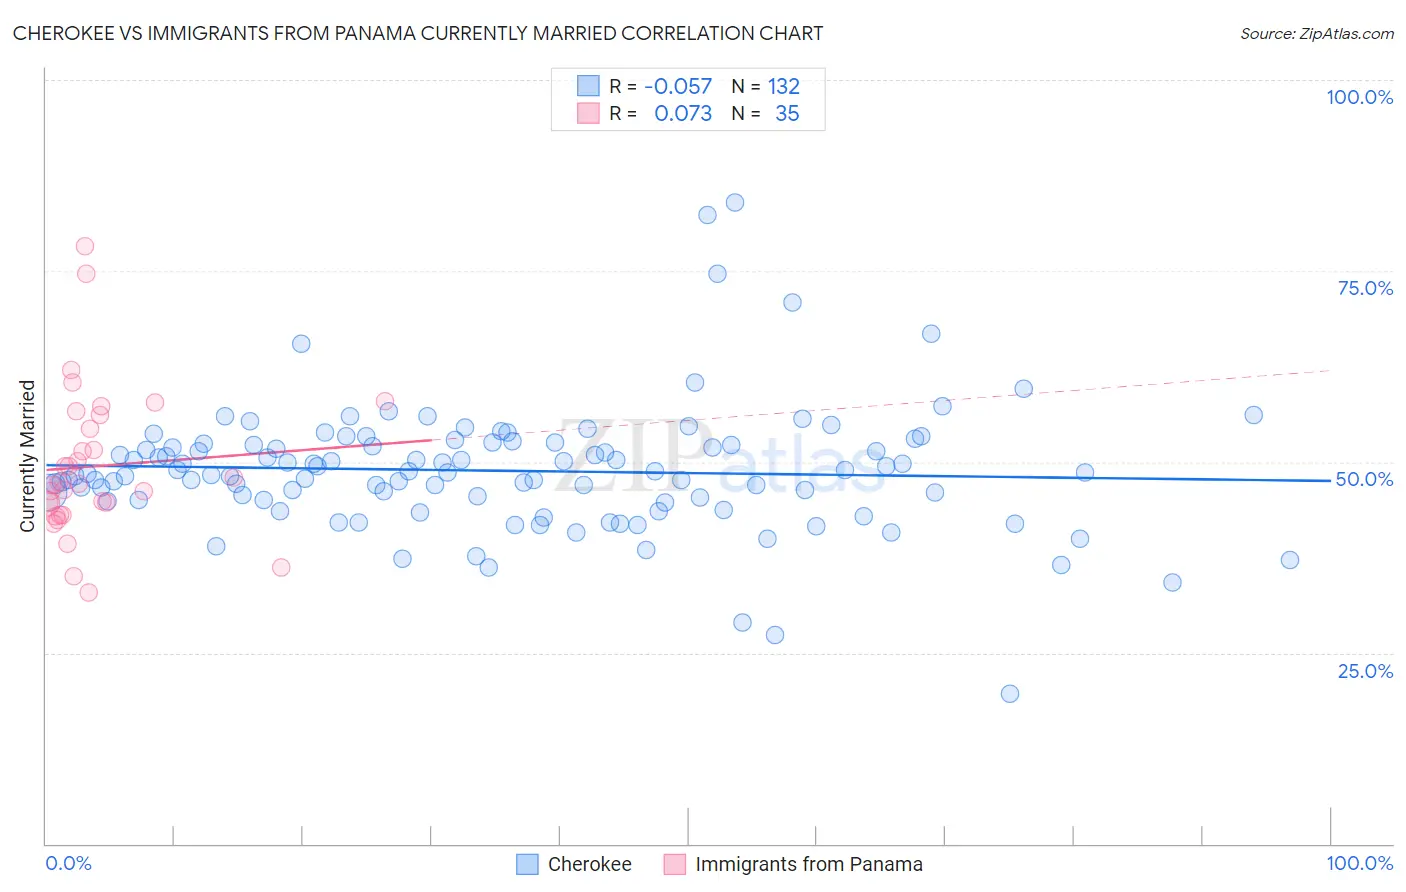
Cherokee vs Immigrants from Panama Currently Married Correlation Chart
The statistical analysis conducted on geographies consisting of 493,651,185 people shows a slight negative correlation between the proportion of Cherokee and percentage of population currently married in the United States with a correlation coefficient (R) of -0.057 and weighted average of 46.9%. Similarly, the statistical analysis conducted on geographies consisting of 221,180,776 people shows a slight positive correlation between the proportion of Immigrants from Panama and percentage of population currently married in the United States with a correlation coefficient (R) of 0.073 and weighted average of 44.9%, a difference of 4.6%.
Currently Married Correlation Summary
| Measurement | Cherokee | Immigrants from Panama |
| Minimum | 19.6% | 32.9% |
| Maximum | 84.0% | 78.2% |
| Range | 64.4% | 45.3% |
| Mean | 48.8% | 49.5% |
| Median | 48.6% | 47.2% |
| Interquartile 25% (IQ1) | 45.0% | 43.1% |
| Interquartile 75% (IQ3) | 52.3% | 56.2% |
| Interquartile Range (IQR) | 7.4% | 13.1% |
| Standard Deviation (Sample) | 8.4% | 9.7% |
| Standard Deviation (Population) | 8.4% | 9.6% |
Similar Demographics by Currently Married
Demographics Similar to Cherokee by Currently Married
In terms of currently married, the demographic groups most similar to Cherokee are Iraqi (46.9%, a difference of 0.020%), Immigrants from Uzbekistan (46.9%, a difference of 0.030%), Immigrants from Southern Europe (46.9%, a difference of 0.030%), Immigrants from Switzerland (46.9%, a difference of 0.040%), and Spanish (47.0%, a difference of 0.050%).
| Demographics | Rating | Rank | Currently Married |
| Chileans | 69.8 /100 | #151 | Good 47.0% |
| Immigrants | Serbia | 68.8 /100 | #152 | Good 47.0% |
| Immigrants | Venezuela | 68.6 /100 | #153 | Good 47.0% |
| Albanians | 68.6 /100 | #154 | Good 47.0% |
| Arabs | 68.6 /100 | #155 | Good 47.0% |
| Spanish | 68.1 /100 | #156 | Good 47.0% |
| Immigrants | Switzerland | 67.8 /100 | #157 | Good 46.9% |
| Cherokee | 66.8 /100 | #158 | Good 46.9% |
| Iraqis | 66.4 /100 | #159 | Good 46.9% |
| Immigrants | Uzbekistan | 66.0 /100 | #160 | Good 46.9% |
| Immigrants | Southern Europe | 65.9 /100 | #161 | Good 46.9% |
| Immigrants | Nonimmigrants | 65.4 /100 | #162 | Good 46.9% |
| Delaware | 64.7 /100 | #163 | Good 46.9% |
| Immigrants | Western Asia | 64.2 /100 | #164 | Good 46.9% |
| Samoans | 59.8 /100 | #165 | Average 46.8% |
Demographics Similar to Immigrants from Panama by Currently Married
In terms of currently married, the demographic groups most similar to Immigrants from Panama are Immigrants from Kenya (44.9%, a difference of 0.040%), Cree (44.9%, a difference of 0.080%), Nepalese (44.7%, a difference of 0.26%), Spanish American (45.0%, a difference of 0.27%), and Immigrants from Uruguay (45.0%, a difference of 0.27%).
| Demographics | Rating | Rank | Currently Married |
| Immigrants | Uganda | 2.2 /100 | #224 | Tragic 45.0% |
| French American Indians | 2.2 /100 | #225 | Tragic 45.0% |
| Comanche | 2.1 /100 | #226 | Tragic 45.0% |
| Spanish Americans | 2.1 /100 | #227 | Tragic 45.0% |
| Immigrants | Uruguay | 2.0 /100 | #228 | Tragic 45.0% |
| Cree | 1.7 /100 | #229 | Tragic 44.9% |
| Immigrants | Kenya | 1.6 /100 | #230 | Tragic 44.9% |
| Immigrants | Panama | 1.5 /100 | #231 | Tragic 44.9% |
| Nepalese | 1.2 /100 | #232 | Tragic 44.7% |
| Immigrants | Saudi Arabia | 1.1 /100 | #233 | Tragic 44.7% |
| Iroquois | 1.1 /100 | #234 | Tragic 44.7% |
| Alaskan Athabascans | 0.9 /100 | #235 | Tragic 44.6% |
| Cubans | 0.9 /100 | #236 | Tragic 44.6% |
| Seminole | 0.9 /100 | #237 | Tragic 44.6% |
| Moroccans | 0.9 /100 | #238 | Tragic 44.6% |