Cherokee vs Immigrants from Indonesia Currently Married
COMPARE
Cherokee
Immigrants from Indonesia
Currently Married
Currently Married Comparison
Cherokee
Immigrants from Indonesia
46.9%
CURRENTLY MARRIED
66.8/ 100
METRIC RATING
158th/ 347
METRIC RANK
47.6%
CURRENTLY MARRIED
90.5/ 100
METRIC RATING
115th/ 347
METRIC RANK
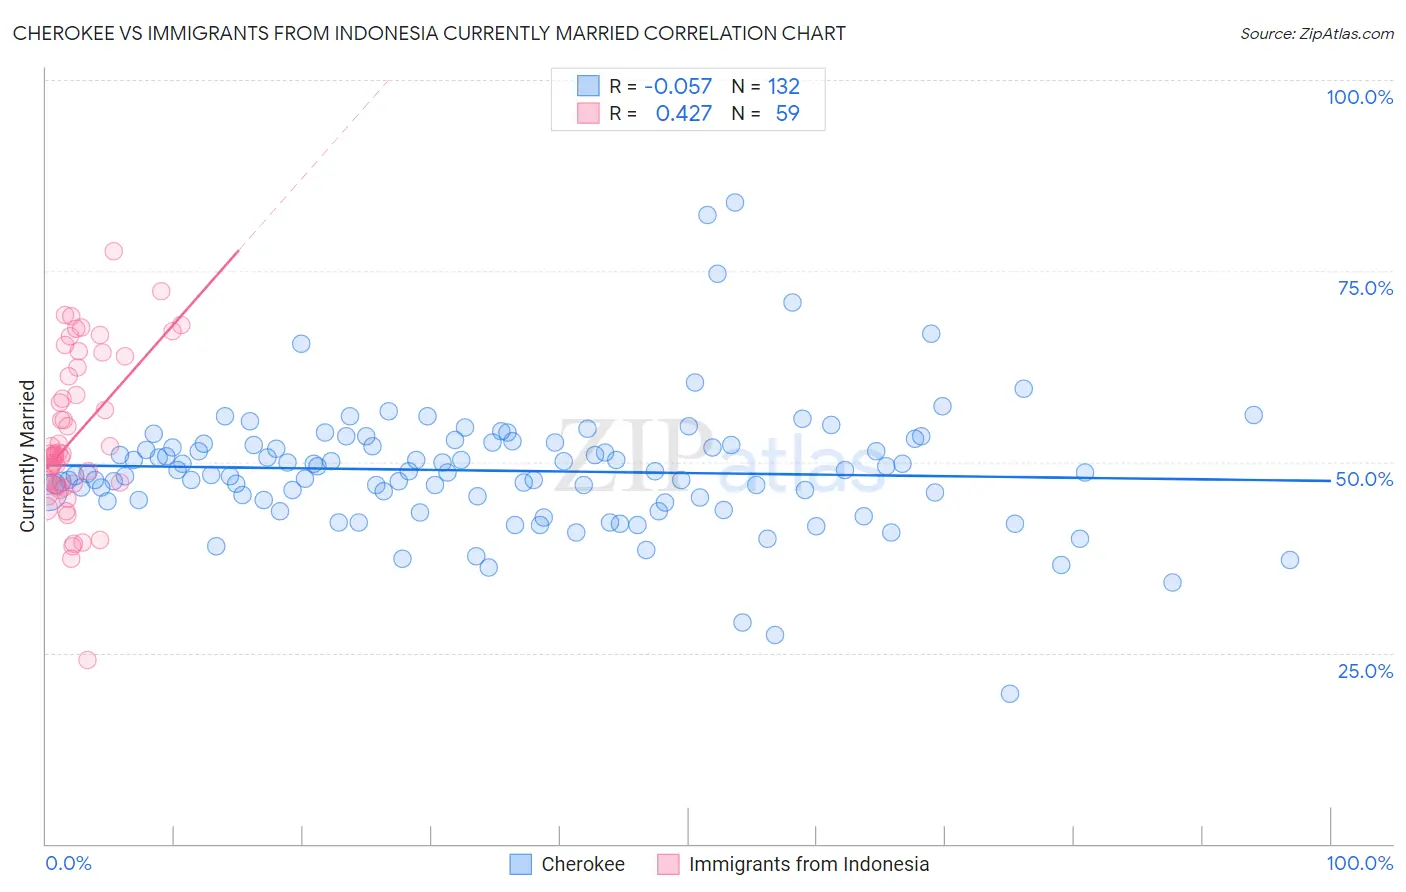
Cherokee vs Immigrants from Indonesia Currently Married Correlation Chart
The statistical analysis conducted on geographies consisting of 493,651,185 people shows a slight negative correlation between the proportion of Cherokee and percentage of population currently married in the United States with a correlation coefficient (R) of -0.057 and weighted average of 46.9%. Similarly, the statistical analysis conducted on geographies consisting of 215,768,024 people shows a moderate positive correlation between the proportion of Immigrants from Indonesia and percentage of population currently married in the United States with a correlation coefficient (R) of 0.427 and weighted average of 47.6%, a difference of 1.4%.
Currently Married Correlation Summary
| Measurement | Cherokee | Immigrants from Indonesia |
| Minimum | 19.6% | 24.1% |
| Maximum | 84.0% | 77.5% |
| Range | 64.4% | 53.4% |
| Mean | 48.8% | 53.3% |
| Median | 48.6% | 51.0% |
| Interquartile 25% (IQ1) | 45.0% | 46.9% |
| Interquartile 75% (IQ3) | 52.3% | 62.4% |
| Interquartile Range (IQR) | 7.4% | 15.5% |
| Standard Deviation (Sample) | 8.4% | 10.3% |
| Standard Deviation (Population) | 8.4% | 10.2% |
Similar Demographics by Currently Married
Demographics Similar to Cherokee by Currently Married
In terms of currently married, the demographic groups most similar to Cherokee are Iraqi (46.9%, a difference of 0.020%), Immigrants from Uzbekistan (46.9%, a difference of 0.030%), Immigrants from Southern Europe (46.9%, a difference of 0.030%), Immigrants from Switzerland (46.9%, a difference of 0.040%), and Spanish (47.0%, a difference of 0.050%).
| Demographics | Rating | Rank | Currently Married |
| Chileans | 69.8 /100 | #151 | Good 47.0% |
| Immigrants | Serbia | 68.8 /100 | #152 | Good 47.0% |
| Immigrants | Venezuela | 68.6 /100 | #153 | Good 47.0% |
| Albanians | 68.6 /100 | #154 | Good 47.0% |
| Arabs | 68.6 /100 | #155 | Good 47.0% |
| Spanish | 68.1 /100 | #156 | Good 47.0% |
| Immigrants | Switzerland | 67.8 /100 | #157 | Good 46.9% |
| Cherokee | 66.8 /100 | #158 | Good 46.9% |
| Iraqis | 66.4 /100 | #159 | Good 46.9% |
| Immigrants | Uzbekistan | 66.0 /100 | #160 | Good 46.9% |
| Immigrants | Southern Europe | 65.9 /100 | #161 | Good 46.9% |
| Immigrants | Nonimmigrants | 65.4 /100 | #162 | Good 46.9% |
| Delaware | 64.7 /100 | #163 | Good 46.9% |
| Immigrants | Western Asia | 64.2 /100 | #164 | Good 46.9% |
| Samoans | 59.8 /100 | #165 | Average 46.8% |
Demographics Similar to Immigrants from Indonesia by Currently Married
In terms of currently married, the demographic groups most similar to Immigrants from Indonesia are South African (47.6%, a difference of 0.0%), Palestinian (47.6%, a difference of 0.010%), Puget Sound Salish (47.6%, a difference of 0.020%), Immigrants from Philippines (47.6%, a difference of 0.030%), and Australian (47.6%, a difference of 0.030%).
| Demographics | Rating | Rank | Currently Married |
| Tsimshian | 92.4 /100 | #108 | Exceptional 47.7% |
| Immigrants | Egypt | 92.3 /100 | #109 | Exceptional 47.7% |
| Immigrants | Russia | 92.0 /100 | #110 | Exceptional 47.7% |
| Immigrants | Hungary | 91.2 /100 | #111 | Exceptional 47.6% |
| Immigrants | Western Europe | 91.1 /100 | #112 | Exceptional 47.6% |
| Immigrants | Denmark | 90.9 /100 | #113 | Exceptional 47.6% |
| South Africans | 90.5 /100 | #114 | Exceptional 47.6% |
| Immigrants | Indonesia | 90.5 /100 | #115 | Exceptional 47.6% |
| Palestinians | 90.4 /100 | #116 | Exceptional 47.6% |
| Puget Sound Salish | 90.3 /100 | #117 | Exceptional 47.6% |
| Immigrants | Philippines | 90.2 /100 | #118 | Exceptional 47.6% |
| Australians | 90.2 /100 | #119 | Exceptional 47.6% |
| Syrians | 88.9 /100 | #120 | Excellent 47.5% |
| Immigrants | Croatia | 88.6 /100 | #121 | Excellent 47.5% |
| Osage | 87.9 /100 | #122 | Excellent 47.5% |