Cherokee vs Celtic Births to Unmarried Women
COMPARE
Cherokee
Celtic
Births to Unmarried Women
Births to Unmarried Women Comparison
Cherokee
Celtics
36.7%
BIRTHS TO UNMARRIED WOMEN
0.1/ 100
METRIC RATING
265th/ 347
METRIC RANK
33.3%
BIRTHS TO UNMARRIED WOMEN
10.2/ 100
METRIC RATING
212th/ 347
METRIC RANK
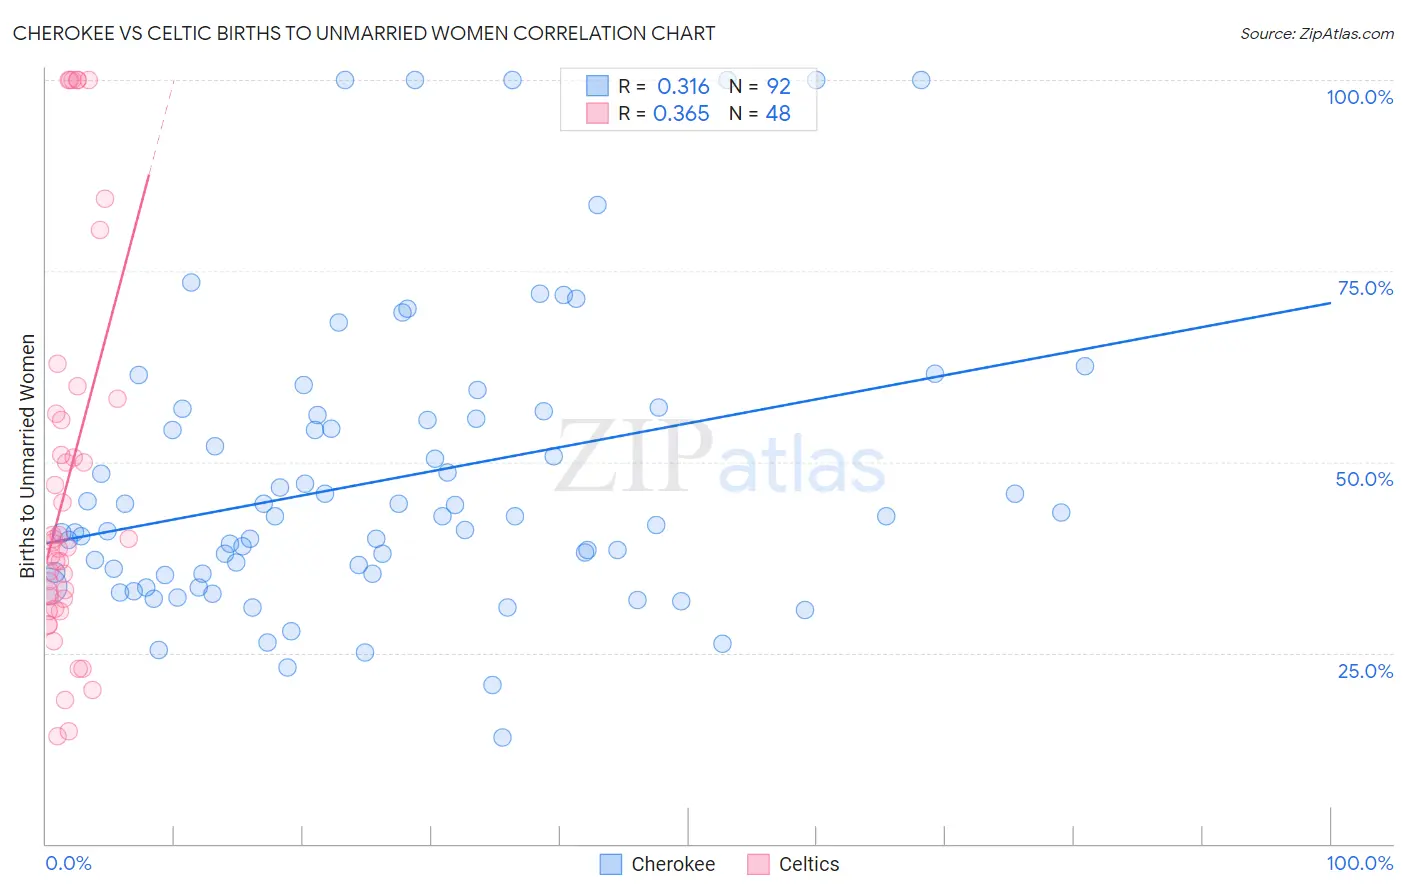
Cherokee vs Celtic Births to Unmarried Women Correlation Chart
The statistical analysis conducted on geographies consisting of 454,419,943 people shows a mild positive correlation between the proportion of Cherokee and percentage of births to unmarried women in the United States with a correlation coefficient (R) of 0.316 and weighted average of 36.7%. Similarly, the statistical analysis conducted on geographies consisting of 162,463,744 people shows a mild positive correlation between the proportion of Celtics and percentage of births to unmarried women in the United States with a correlation coefficient (R) of 0.365 and weighted average of 33.3%, a difference of 10.1%.
Births to Unmarried Women Correlation Summary
| Measurement | Cherokee | Celtic |
| Minimum | 13.9% | 14.0% |
| Maximum | 100.0% | 100.0% |
| Range | 86.1% | 86.0% |
| Mean | 47.7% | 47.2% |
| Median | 42.9% | 39.1% |
| Interquartile 25% (IQ1) | 35.4% | 31.5% |
| Interquartile 75% (IQ3) | 55.8% | 55.9% |
| Interquartile Range (IQR) | 20.5% | 24.4% |
| Standard Deviation (Sample) | 19.1% | 24.7% |
| Standard Deviation (Population) | 19.0% | 24.5% |
Similar Demographics by Births to Unmarried Women
Demographics Similar to Cherokee by Births to Unmarried Women
In terms of births to unmarried women, the demographic groups most similar to Cherokee are Subsaharan African (36.7%, a difference of 0.050%), Immigrants from Senegal (36.7%, a difference of 0.050%), Central American (36.7%, a difference of 0.12%), Comanche (36.7%, a difference of 0.13%), and Nicaraguan (36.6%, a difference of 0.17%).
| Demographics | Rating | Rank | Births to Unmarried Women |
| Americans | 0.2 /100 | #258 | Tragic 36.4% |
| Immigrants | El Salvador | 0.2 /100 | #259 | Tragic 36.4% |
| Ottawa | 0.2 /100 | #260 | Tragic 36.5% |
| Trinidadians and Tobagonians | 0.2 /100 | #261 | Tragic 36.5% |
| French American Indians | 0.1 /100 | #262 | Tragic 36.6% |
| Nicaraguans | 0.1 /100 | #263 | Tragic 36.6% |
| Sub-Saharan Africans | 0.1 /100 | #264 | Tragic 36.7% |
| Cherokee | 0.1 /100 | #265 | Tragic 36.7% |
| Immigrants | Senegal | 0.1 /100 | #266 | Tragic 36.7% |
| Central Americans | 0.1 /100 | #267 | Tragic 36.7% |
| Comanche | 0.1 /100 | #268 | Tragic 36.7% |
| Senegalese | 0.1 /100 | #269 | Tragic 36.8% |
| Immigrants | Congo | 0.1 /100 | #270 | Tragic 36.8% |
| Immigrants | Barbados | 0.1 /100 | #271 | Tragic 36.8% |
| Choctaw | 0.1 /100 | #272 | Tragic 36.9% |
Demographics Similar to Celtics by Births to Unmarried Women
In terms of births to unmarried women, the demographic groups most similar to Celtics are Ecuadorian (33.3%, a difference of 0.070%), White/Caucasian (33.3%, a difference of 0.12%), Scotch-Irish (33.3%, a difference of 0.12%), Immigrants from Costa Rica (33.4%, a difference of 0.19%), and Slovak (33.4%, a difference of 0.24%).
| Demographics | Rating | Rank | Births to Unmarried Women |
| German Russians | 13.1 /100 | #205 | Poor 33.1% |
| Uruguayans | 12.8 /100 | #206 | Poor 33.1% |
| Immigrants | Sudan | 11.5 /100 | #207 | Poor 33.2% |
| Hawaiians | 11.3 /100 | #208 | Poor 33.2% |
| Whites/Caucasians | 10.7 /100 | #209 | Poor 33.3% |
| Scotch-Irish | 10.7 /100 | #210 | Poor 33.3% |
| Ecuadorians | 10.5 /100 | #211 | Poor 33.3% |
| Celtics | 10.2 /100 | #212 | Poor 33.3% |
| Immigrants | Costa Rica | 9.5 /100 | #213 | Tragic 33.4% |
| Slovaks | 9.3 /100 | #214 | Tragic 33.4% |
| French | 8.7 /100 | #215 | Tragic 33.4% |
| Nepalese | 7.8 /100 | #216 | Tragic 33.5% |
| Spaniards | 7.0 /100 | #217 | Tragic 33.6% |
| Immigrants | Ecuador | 5.9 /100 | #218 | Tragic 33.7% |
| Alsatians | 5.4 /100 | #219 | Tragic 33.8% |