Cherokee vs Immigrants from Kuwait Births to Unmarried Women
COMPARE
Cherokee
Immigrants from Kuwait
Births to Unmarried Women
Births to Unmarried Women Comparison
Cherokee
Immigrants from Kuwait
36.7%
BIRTHS TO UNMARRIED WOMEN
0.1/ 100
METRIC RATING
265th/ 347
METRIC RANK
28.8%
BIRTHS TO UNMARRIED WOMEN
98.0/ 100
METRIC RATING
83rd/ 347
METRIC RANK
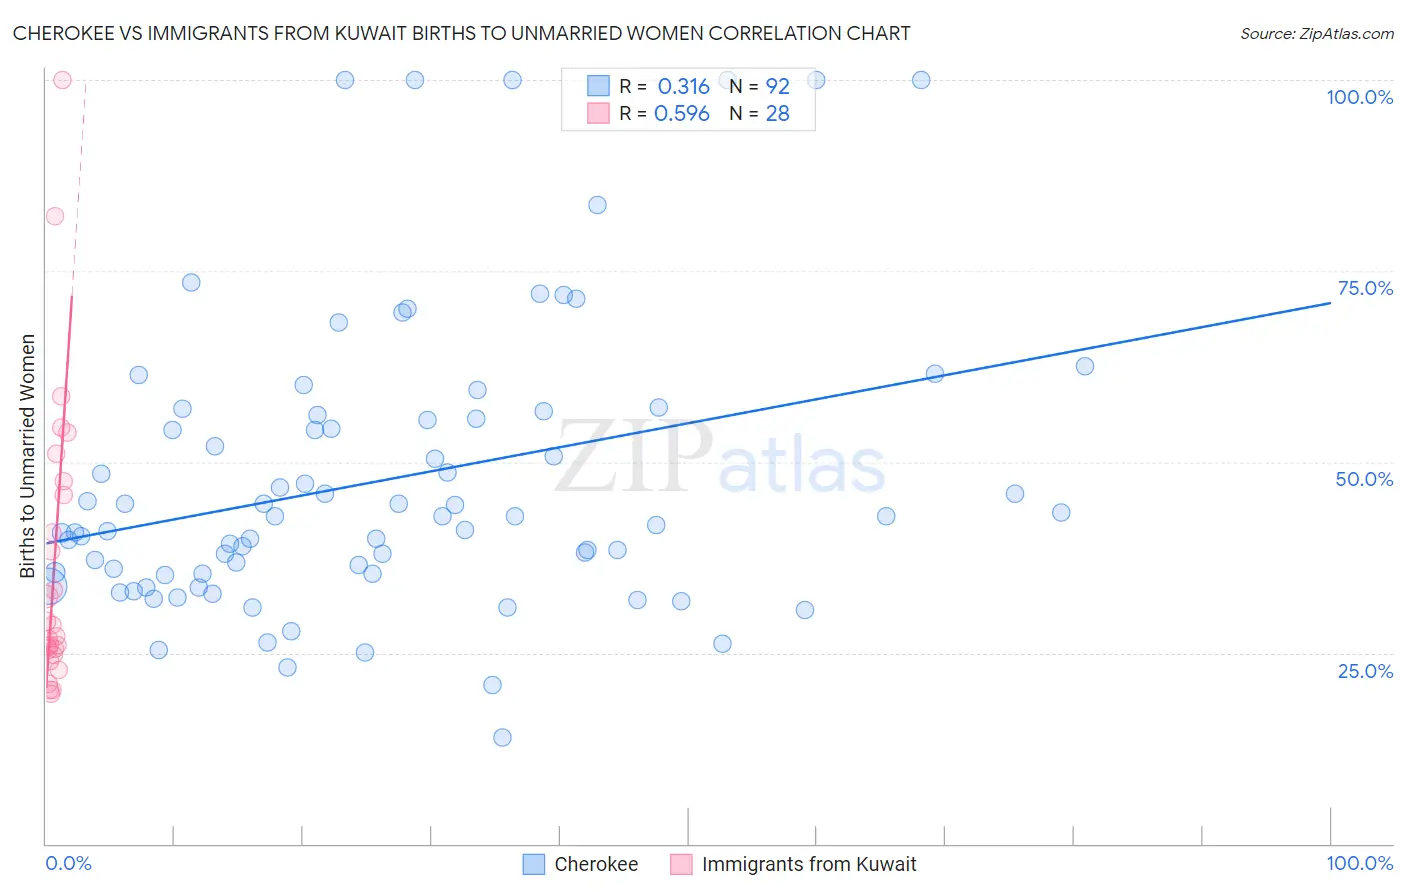
Cherokee vs Immigrants from Kuwait Births to Unmarried Women Correlation Chart
The statistical analysis conducted on geographies consisting of 454,419,943 people shows a mild positive correlation between the proportion of Cherokee and percentage of births to unmarried women in the United States with a correlation coefficient (R) of 0.316 and weighted average of 36.7%. Similarly, the statistical analysis conducted on geographies consisting of 132,321,257 people shows a substantial positive correlation between the proportion of Immigrants from Kuwait and percentage of births to unmarried women in the United States with a correlation coefficient (R) of 0.596 and weighted average of 28.8%, a difference of 27.5%.
Births to Unmarried Women Correlation Summary
| Measurement | Cherokee | Immigrants from Kuwait |
| Minimum | 13.9% | 19.6% |
| Maximum | 100.0% | 100.0% |
| Range | 86.1% | 80.4% |
| Mean | 47.7% | 36.8% |
| Median | 42.9% | 27.9% |
| Interquartile 25% (IQ1) | 35.4% | 25.1% |
| Interquartile 75% (IQ3) | 55.8% | 46.5% |
| Interquartile Range (IQR) | 20.5% | 21.4% |
| Standard Deviation (Sample) | 19.1% | 19.3% |
| Standard Deviation (Population) | 19.0% | 19.0% |
Similar Demographics by Births to Unmarried Women
Demographics Similar to Cherokee by Births to Unmarried Women
In terms of births to unmarried women, the demographic groups most similar to Cherokee are Subsaharan African (36.7%, a difference of 0.050%), Immigrants from Senegal (36.7%, a difference of 0.050%), Central American (36.7%, a difference of 0.12%), Comanche (36.7%, a difference of 0.13%), and Nicaraguan (36.6%, a difference of 0.17%).
| Demographics | Rating | Rank | Births to Unmarried Women |
| Americans | 0.2 /100 | #258 | Tragic 36.4% |
| Immigrants | El Salvador | 0.2 /100 | #259 | Tragic 36.4% |
| Ottawa | 0.2 /100 | #260 | Tragic 36.5% |
| Trinidadians and Tobagonians | 0.2 /100 | #261 | Tragic 36.5% |
| French American Indians | 0.1 /100 | #262 | Tragic 36.6% |
| Nicaraguans | 0.1 /100 | #263 | Tragic 36.6% |
| Sub-Saharan Africans | 0.1 /100 | #264 | Tragic 36.7% |
| Cherokee | 0.1 /100 | #265 | Tragic 36.7% |
| Immigrants | Senegal | 0.1 /100 | #266 | Tragic 36.7% |
| Central Americans | 0.1 /100 | #267 | Tragic 36.7% |
| Comanche | 0.1 /100 | #268 | Tragic 36.7% |
| Senegalese | 0.1 /100 | #269 | Tragic 36.8% |
| Immigrants | Congo | 0.1 /100 | #270 | Tragic 36.8% |
| Immigrants | Barbados | 0.1 /100 | #271 | Tragic 36.8% |
| Choctaw | 0.1 /100 | #272 | Tragic 36.9% |
Demographics Similar to Immigrants from Kuwait by Births to Unmarried Women
In terms of births to unmarried women, the demographic groups most similar to Immigrants from Kuwait are Romanian (28.7%, a difference of 0.080%), Immigrants from Austria (28.7%, a difference of 0.18%), Immigrants from Afghanistan (28.7%, a difference of 0.23%), Danish (28.7%, a difference of 0.25%), and Zimbabwean (28.7%, a difference of 0.27%).
| Demographics | Rating | Rank | Births to Unmarried Women |
| Israelis | 98.4 /100 | #76 | Exceptional 28.6% |
| Immigrants | Northern Europe | 98.3 /100 | #77 | Exceptional 28.6% |
| Zimbabweans | 98.2 /100 | #78 | Exceptional 28.7% |
| Danes | 98.2 /100 | #79 | Exceptional 28.7% |
| Immigrants | Afghanistan | 98.1 /100 | #80 | Exceptional 28.7% |
| Immigrants | Austria | 98.1 /100 | #81 | Exceptional 28.7% |
| Romanians | 98.0 /100 | #82 | Exceptional 28.7% |
| Immigrants | Kuwait | 98.0 /100 | #83 | Exceptional 28.8% |
| Immigrants | Poland | 97.6 /100 | #84 | Exceptional 28.9% |
| Sri Lankans | 97.5 /100 | #85 | Exceptional 28.9% |
| Immigrants | Jordan | 97.4 /100 | #86 | Exceptional 29.0% |
| Taiwanese | 97.3 /100 | #87 | Exceptional 29.0% |
| Immigrants | France | 97.3 /100 | #88 | Exceptional 29.0% |
| Immigrants | Saudi Arabia | 97.0 /100 | #89 | Exceptional 29.1% |
| Immigrants | Latvia | 96.8 /100 | #90 | Exceptional 29.1% |