Central American vs Immigrants from Uganda Householder Income Over 65 years
COMPARE
Central American
Immigrants from Uganda
Householder Income Over 65 years
Householder Income Over 65 years Comparison
Central Americans
Immigrants from Uganda
$56,321
HOUSEHOLDER INCOME OVER 65 YEARS
0.8/ 100
METRIC RATING
246th/ 347
METRIC RANK
$61,976
HOUSEHOLDER INCOME OVER 65 YEARS
74.2/ 100
METRIC RATING
145th/ 347
METRIC RANK
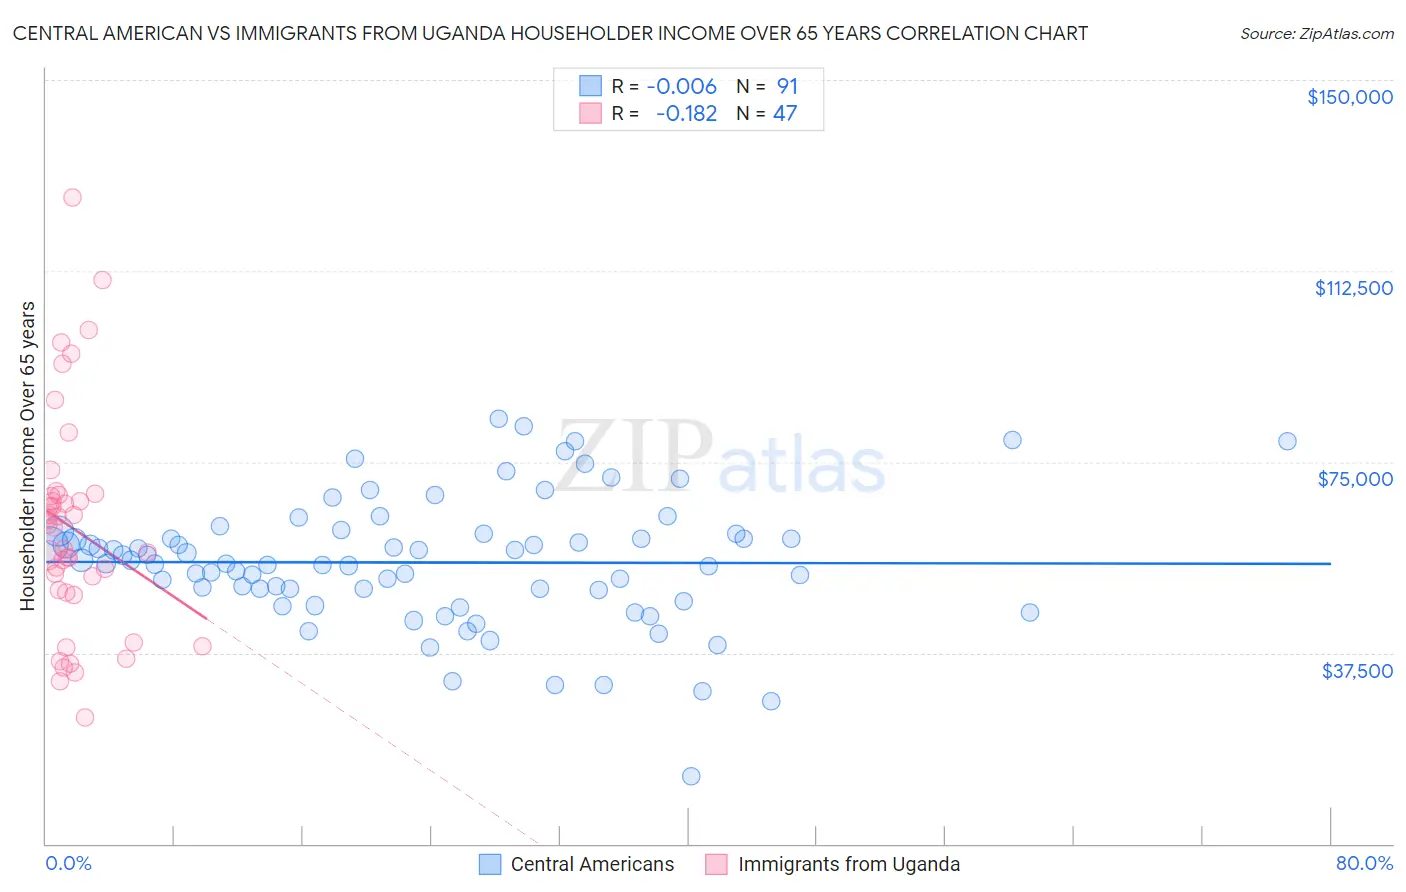
Central American vs Immigrants from Uganda Householder Income Over 65 years Correlation Chart
The statistical analysis conducted on geographies consisting of 501,593,998 people shows no correlation between the proportion of Central Americans and household income with householder over the age of 65 in the United States with a correlation coefficient (R) of -0.006 and weighted average of $56,321. Similarly, the statistical analysis conducted on geographies consisting of 125,899,990 people shows a poor negative correlation between the proportion of Immigrants from Uganda and household income with householder over the age of 65 in the United States with a correlation coefficient (R) of -0.182 and weighted average of $61,976, a difference of 10.0%.
Householder Income Over 65 years Correlation Summary
| Measurement | Central American | Immigrants from Uganda |
| Minimum | $13,371 | $24,703 |
| Maximum | $83,405 | $126,964 |
| Range | $70,034 | $102,261 |
| Mean | $55,234 | $61,928 |
| Median | $55,069 | $62,109 |
| Interquartile 25% (IQ1) | $49,853 | $49,375 |
| Interquartile 75% (IQ3) | $60,940 | $68,535 |
| Interquartile Range (IQR) | $11,087 | $19,160 |
| Standard Deviation (Sample) | $12,548 | $21,649 |
| Standard Deviation (Population) | $12,479 | $21,418 |
Similar Demographics by Householder Income Over 65 years
Demographics Similar to Central Americans by Householder Income Over 65 years
In terms of householder income over 65 years, the demographic groups most similar to Central Americans are Immigrants from Uzbekistan ($56,331, a difference of 0.020%), Hmong ($56,339, a difference of 0.030%), Guyanese ($56,351, a difference of 0.050%), Yakama ($56,234, a difference of 0.15%), and Yaqui ($56,417, a difference of 0.17%).
| Demographics | Rating | Rank | Householder Income Over 65 years |
| Immigrants | Laos | 1.2 /100 | #239 | Tragic $56,722 |
| Sub-Saharan Africans | 1.0 /100 | #240 | Tragic $56,615 |
| Immigrants | Guyana | 0.9 /100 | #241 | Tragic $56,495 |
| Yaqui | 0.8 /100 | #242 | Tragic $56,417 |
| Guyanese | 0.8 /100 | #243 | Tragic $56,351 |
| Hmong | 0.8 /100 | #244 | Tragic $56,339 |
| Immigrants | Uzbekistan | 0.8 /100 | #245 | Tragic $56,331 |
| Central Americans | 0.8 /100 | #246 | Tragic $56,321 |
| Yakama | 0.7 /100 | #247 | Tragic $56,234 |
| Vietnamese | 0.6 /100 | #248 | Tragic $56,143 |
| Mexican American Indians | 0.6 /100 | #249 | Tragic $56,089 |
| Immigrants | Bosnia and Herzegovina | 0.5 /100 | #250 | Tragic $55,986 |
| Immigrants | Portugal | 0.5 /100 | #251 | Tragic $55,924 |
| Osage | 0.4 /100 | #252 | Tragic $55,677 |
| Immigrants | Trinidad and Tobago | 0.4 /100 | #253 | Tragic $55,598 |
Demographics Similar to Immigrants from Uganda by Householder Income Over 65 years
In terms of householder income over 65 years, the demographic groups most similar to Immigrants from Uganda are Immigrants from Peru ($61,988, a difference of 0.020%), Immigrants from Southern Europe ($61,902, a difference of 0.12%), Immigrants from Nepal ($61,843, a difference of 0.22%), Alsatian ($61,797, a difference of 0.29%), and Immigrants from Belarus ($62,162, a difference of 0.30%).
| Demographics | Rating | Rank | Householder Income Over 65 years |
| Immigrants | Kazakhstan | 80.0 /100 | #138 | Excellent $62,292 |
| Lebanese | 79.9 /100 | #139 | Good $62,287 |
| Arabs | 79.6 /100 | #140 | Good $62,266 |
| Canadians | 79.0 /100 | #141 | Good $62,230 |
| South American Indians | 78.7 /100 | #142 | Good $62,215 |
| Immigrants | Belarus | 77.8 /100 | #143 | Good $62,162 |
| Immigrants | Peru | 74.4 /100 | #144 | Good $61,988 |
| Immigrants | Uganda | 74.2 /100 | #145 | Good $61,976 |
| Immigrants | Southern Europe | 72.7 /100 | #146 | Good $61,902 |
| Immigrants | Nepal | 71.4 /100 | #147 | Good $61,843 |
| Alsatians | 70.5 /100 | #148 | Good $61,797 |
| Scottish | 69.1 /100 | #149 | Good $61,735 |
| Slavs | 68.5 /100 | #150 | Good $61,709 |
| Hungarians | 67.7 /100 | #151 | Good $61,673 |
| Armenians | 67.3 /100 | #152 | Good $61,656 |