Swiss vs Immigrants from Chile Family Households
COMPARE
Swiss
Immigrants from Chile
Family Households
Family Households Comparison
Swiss
Immigrants from Chile
65.2%
FAMILY HOUSEHOLDS
98.6/ 100
METRIC RATING
96th/ 347
METRIC RANK
64.6%
FAMILY HOUSEHOLDS
76.5/ 100
METRIC RATING
147th/ 347
METRIC RANK
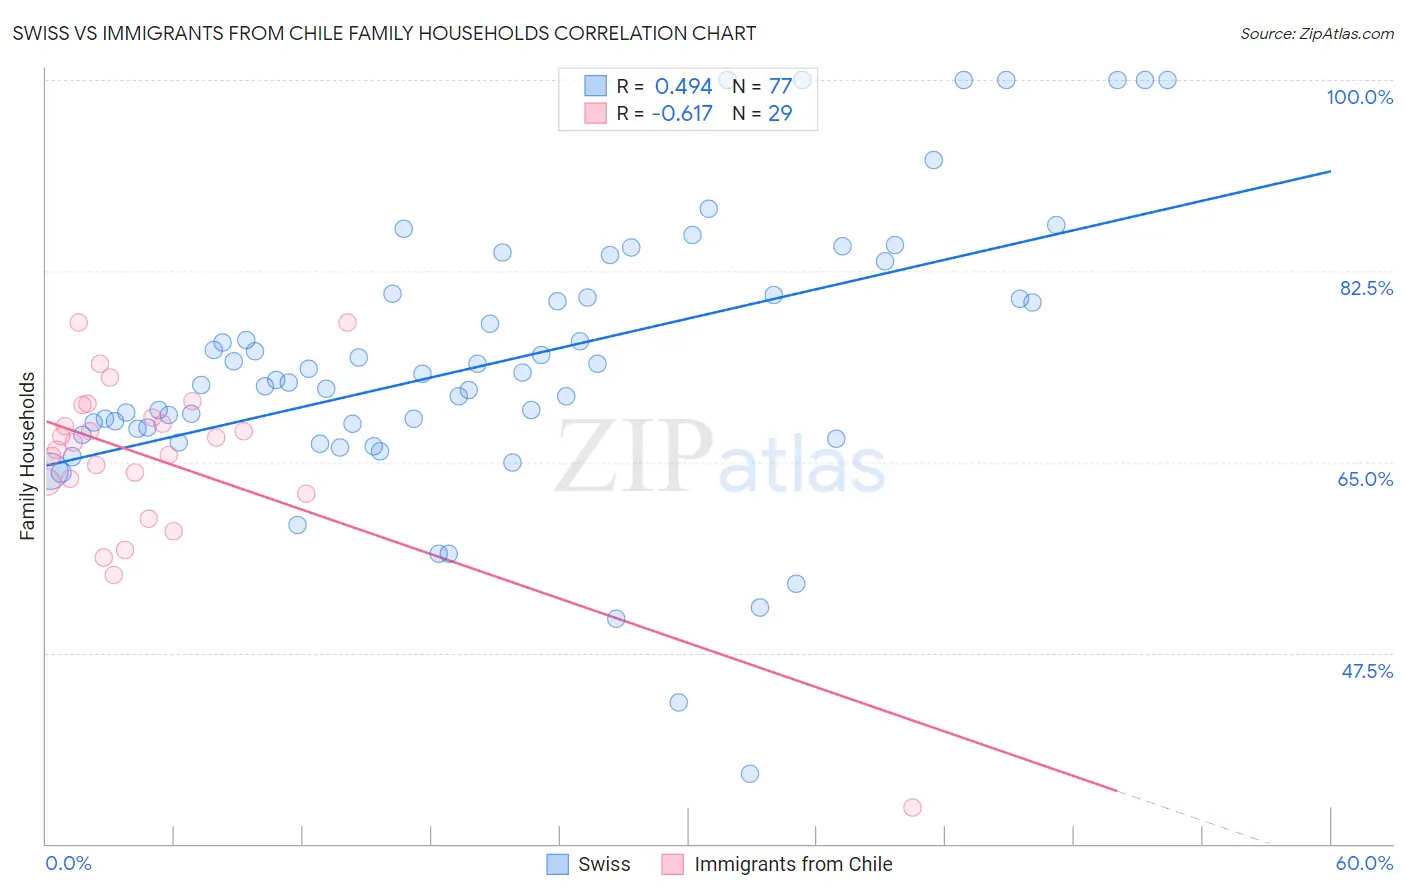
Swiss vs Immigrants from Chile Family Households Correlation Chart
The statistical analysis conducted on geographies consisting of 464,763,466 people shows a moderate positive correlation between the proportion of Swiss and percentage of family households in the United States with a correlation coefficient (R) of 0.494 and weighted average of 65.2%. Similarly, the statistical analysis conducted on geographies consisting of 218,601,267 people shows a significant negative correlation between the proportion of Immigrants from Chile and percentage of family households in the United States with a correlation coefficient (R) of -0.617 and weighted average of 64.6%, a difference of 1.0%.
Family Households Correlation Summary
| Measurement | Swiss | Immigrants from Chile |
| Minimum | 36.4% | 33.3% |
| Maximum | 100.0% | 77.8% |
| Range | 63.6% | 44.5% |
| Mean | 74.1% | 65.2% |
| Median | 72.5% | 66.8% |
| Interquartile 25% (IQ1) | 67.7% | 62.6% |
| Interquartile 75% (IQ3) | 80.3% | 69.7% |
| Interquartile Range (IQR) | 12.6% | 7.0% |
| Standard Deviation (Sample) | 12.7% | 8.4% |
| Standard Deviation (Population) | 12.7% | 8.2% |
Similar Demographics by Family Households
Demographics Similar to Swiss by Family Households
In terms of family households, the demographic groups most similar to Swiss are Guatemalan (65.2%, a difference of 0.0%), Immigrants from Portugal (65.2%, a difference of 0.010%), Immigrants from Poland (65.2%, a difference of 0.030%), Immigrants from Syria (65.2%, a difference of 0.040%), and Hopi (65.3%, a difference of 0.050%).
| Demographics | Rating | Rank | Family Households |
| Immigrants | Caribbean | 99.1 /100 | #89 | Exceptional 65.3% |
| Immigrants | Laos | 99.1 /100 | #90 | Exceptional 65.3% |
| Crow | 98.9 /100 | #91 | Exceptional 65.3% |
| Hopi | 98.8 /100 | #92 | Exceptional 65.3% |
| Guyanese | 98.8 /100 | #93 | Exceptional 65.3% |
| Immigrants | Poland | 98.7 /100 | #94 | Exceptional 65.2% |
| Immigrants | Portugal | 98.6 /100 | #95 | Exceptional 65.2% |
| Swiss | 98.6 /100 | #96 | Exceptional 65.2% |
| Guatemalans | 98.6 /100 | #97 | Exceptional 65.2% |
| Immigrants | Syria | 98.4 /100 | #98 | Exceptional 65.2% |
| Central American Indians | 98.3 /100 | #99 | Exceptional 65.2% |
| Haitians | 98.1 /100 | #100 | Exceptional 65.2% |
| Chileans | 98.1 /100 | #101 | Exceptional 65.2% |
| Immigrants | Sri Lanka | 98.0 /100 | #102 | Exceptional 65.1% |
| Indians (Asian) | 97.9 /100 | #103 | Exceptional 65.1% |
Demographics Similar to Immigrants from Chile by Family Households
In terms of family households, the demographic groups most similar to Immigrants from Chile are Delaware (64.6%, a difference of 0.0%), Sioux (64.6%, a difference of 0.0%), Immigrants from Romania (64.6%, a difference of 0.010%), Romanian (64.5%, a difference of 0.020%), and Syrian (64.5%, a difference of 0.020%).
| Demographics | Rating | Rank | Family Households |
| Immigrants | North Macedonia | 84.9 /100 | #140 | Excellent 64.7% |
| Immigrants | Cameroon | 84.8 /100 | #141 | Excellent 64.7% |
| Pakistanis | 84.0 /100 | #142 | Excellent 64.7% |
| Czechoslovakians | 82.1 /100 | #143 | Excellent 64.6% |
| South American Indians | 81.9 /100 | #144 | Excellent 64.6% |
| Welsh | 80.1 /100 | #145 | Excellent 64.6% |
| Immigrants | Romania | 77.0 /100 | #146 | Good 64.6% |
| Immigrants | Chile | 76.5 /100 | #147 | Good 64.6% |
| Delaware | 76.3 /100 | #148 | Good 64.6% |
| Sioux | 76.3 /100 | #149 | Good 64.6% |
| Romanians | 75.3 /100 | #150 | Good 64.5% |
| Syrians | 75.2 /100 | #151 | Good 64.5% |
| Scottish | 70.9 /100 | #152 | Good 64.5% |
| Swedes | 69.8 /100 | #153 | Good 64.5% |
| Austrians | 68.5 /100 | #154 | Good 64.5% |