Carpatho Rusyn vs Immigrants from Albania Married-couple Households
COMPARE
Carpatho Rusyn
Immigrants from Albania
Married-couple Households
Married-couple Households Comparison
Carpatho Rusyns
Immigrants from Albania
45.7%
MARRIED-COUPLE HOUSEHOLDS
15.7/ 100
METRIC RATING
199th/ 347
METRIC RANK
44.4%
MARRIED-COUPLE HOUSEHOLDS
1.0/ 100
METRIC RATING
242nd/ 347
METRIC RANK
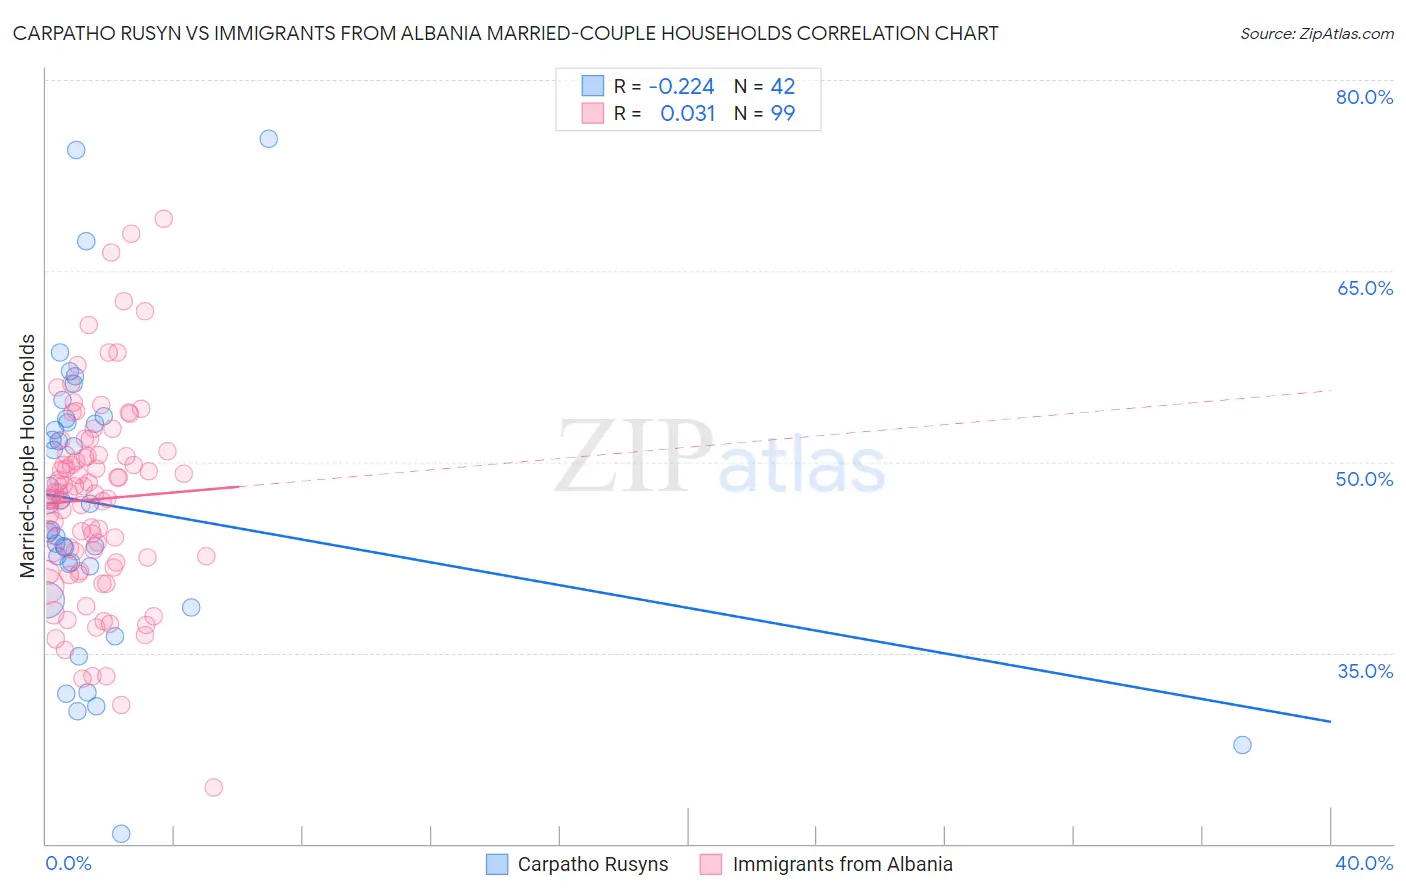
Carpatho Rusyn vs Immigrants from Albania Married-couple Households Correlation Chart
The statistical analysis conducted on geographies consisting of 58,871,690 people shows a weak negative correlation between the proportion of Carpatho Rusyns and percentage of married-couple family households in the United States with a correlation coefficient (R) of -0.224 and weighted average of 45.7%. Similarly, the statistical analysis conducted on geographies consisting of 119,383,494 people shows no correlation between the proportion of Immigrants from Albania and percentage of married-couple family households in the United States with a correlation coefficient (R) of 0.031 and weighted average of 44.4%, a difference of 2.9%.
Married-couple Households Correlation Summary
| Measurement | Carpatho Rusyn | Immigrants from Albania |
| Minimum | 20.8% | 24.4% |
| Maximum | 75.4% | 69.1% |
| Range | 54.6% | 44.7% |
| Mean | 46.6% | 47.0% |
| Median | 45.7% | 47.6% |
| Interquartile 25% (IQ1) | 41.8% | 42.1% |
| Interquartile 75% (IQ3) | 53.1% | 50.5% |
| Interquartile Range (IQR) | 11.3% | 8.4% |
| Standard Deviation (Sample) | 11.4% | 7.9% |
| Standard Deviation (Population) | 11.3% | 7.8% |
Similar Demographics by Married-couple Households
Demographics Similar to Carpatho Rusyns by Married-couple Households
In terms of married-couple households, the demographic groups most similar to Carpatho Rusyns are Potawatomi (45.7%, a difference of 0.010%), Immigrants from Serbia (45.7%, a difference of 0.040%), Immigrants from Central America (45.7%, a difference of 0.12%), Alaska Native (45.6%, a difference of 0.21%), and Ottawa (45.8%, a difference of 0.24%).
| Demographics | Rating | Rank | Married-couple Households |
| Immigrants | Northern Africa | 24.6 /100 | #192 | Fair 46.0% |
| Taiwanese | 23.4 /100 | #193 | Fair 45.9% |
| Mexican American Indians | 23.3 /100 | #194 | Fair 45.9% |
| Chickasaw | 22.7 /100 | #195 | Fair 45.9% |
| Immigrants | South America | 22.2 /100 | #196 | Fair 45.9% |
| Cambodians | 21.3 /100 | #197 | Fair 45.9% |
| Ottawa | 19.4 /100 | #198 | Poor 45.8% |
| Carpatho Rusyns | 15.7 /100 | #199 | Poor 45.7% |
| Potawatomi | 15.6 /100 | #200 | Poor 45.7% |
| Immigrants | Serbia | 15.2 /100 | #201 | Poor 45.7% |
| Immigrants | Central America | 14.2 /100 | #202 | Poor 45.7% |
| Alaska Natives | 13.0 /100 | #203 | Poor 45.6% |
| Aleuts | 12.5 /100 | #204 | Poor 45.6% |
| Nepalese | 11.9 /100 | #205 | Poor 45.6% |
| Uruguayans | 10.4 /100 | #206 | Poor 45.5% |
Demographics Similar to Immigrants from Albania by Married-couple Households
In terms of married-couple households, the demographic groups most similar to Immigrants from Albania are Ute (44.4%, a difference of 0.040%), Immigrants from Bosnia and Herzegovina (44.4%, a difference of 0.040%), Immigrants from Saudi Arabia (44.4%, a difference of 0.070%), Spanish American (44.5%, a difference of 0.12%), and Immigrants from Uruguay (44.5%, a difference of 0.14%).
| Demographics | Rating | Rank | Married-couple Households |
| Immigrants | Nicaragua | 1.2 /100 | #235 | Tragic 44.5% |
| Yaqui | 1.2 /100 | #236 | Tragic 44.5% |
| Comanche | 1.2 /100 | #237 | Tragic 44.5% |
| Immigrants | Uruguay | 1.1 /100 | #238 | Tragic 44.5% |
| Spanish Americans | 1.1 /100 | #239 | Tragic 44.5% |
| Ute | 1.0 /100 | #240 | Tragic 44.4% |
| Immigrants | Bosnia and Herzegovina | 1.0 /100 | #241 | Tragic 44.4% |
| Immigrants | Albania | 1.0 /100 | #242 | Tragic 44.4% |
| Immigrants | Saudi Arabia | 0.9 /100 | #243 | Tragic 44.4% |
| Immigrants | Armenia | 0.7 /100 | #244 | Tragic 44.3% |
| Immigrants | El Salvador | 0.7 /100 | #245 | Tragic 44.3% |
| Immigrants | Cuba | 0.6 /100 | #246 | Tragic 44.2% |
| Immigrants | Morocco | 0.6 /100 | #247 | Tragic 44.2% |
| Yup'ik | 0.4 /100 | #248 | Tragic 44.1% |
| Immigrants | Kenya | 0.4 /100 | #249 | Tragic 44.1% |