Cape Verdean vs Immigrants from South America Male Unemployment
COMPARE
Cape Verdean
Immigrants from South America
Male Unemployment
Male Unemployment Comparison
Cape Verdeans
Immigrants from South America
7.1%
MALE UNEMPLOYMENT
0.0/ 100
METRIC RATING
318th/ 347
METRIC RANK
5.4%
MALE UNEMPLOYMENT
29.4/ 100
METRIC RATING
189th/ 347
METRIC RANK
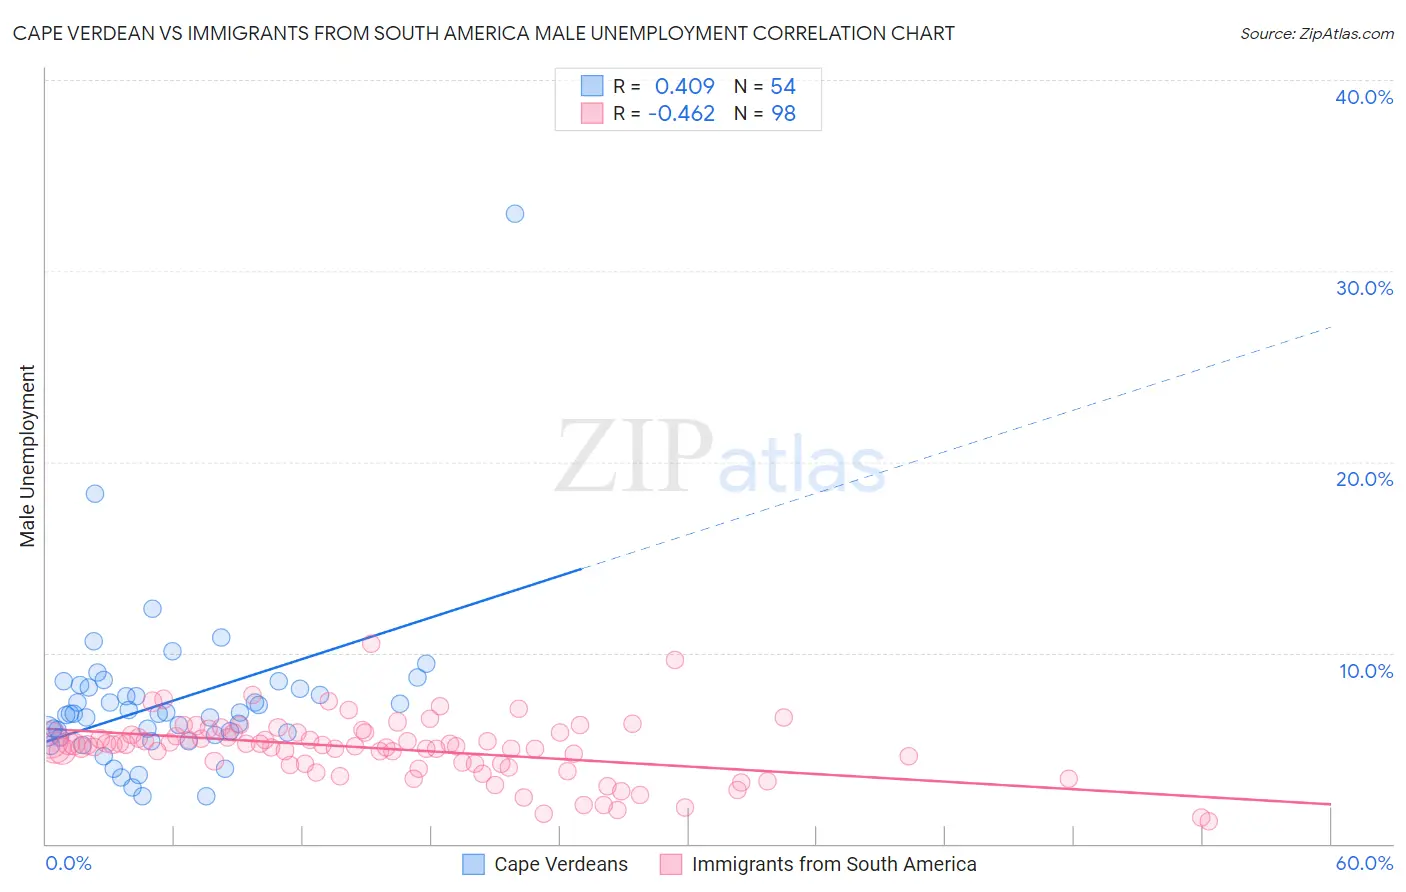
Cape Verdean vs Immigrants from South America Male Unemployment Correlation Chart
The statistical analysis conducted on geographies consisting of 107,471,642 people shows a moderate positive correlation between the proportion of Cape Verdeans and unemployment rate among males in the United States with a correlation coefficient (R) of 0.409 and weighted average of 7.1%. Similarly, the statistical analysis conducted on geographies consisting of 483,078,598 people shows a moderate negative correlation between the proportion of Immigrants from South America and unemployment rate among males in the United States with a correlation coefficient (R) of -0.462 and weighted average of 5.4%, a difference of 32.8%.
Male Unemployment Correlation Summary
| Measurement | Cape Verdean | Immigrants from South America |
| Minimum | 2.5% | 1.2% |
| Maximum | 33.0% | 10.5% |
| Range | 30.5% | 9.3% |
| Mean | 7.4% | 5.0% |
| Median | 6.8% | 5.2% |
| Interquartile 25% (IQ1) | 5.7% | 4.2% |
| Interquartile 75% (IQ3) | 8.2% | 5.8% |
| Interquartile Range (IQR) | 2.5% | 1.6% |
| Standard Deviation (Sample) | 4.4% | 1.6% |
| Standard Deviation (Population) | 4.3% | 1.6% |
Similar Demographics by Male Unemployment
Demographics Similar to Cape Verdeans by Male Unemployment
In terms of male unemployment, the demographic groups most similar to Cape Verdeans are Guyanese (7.1%, a difference of 0.070%), Immigrants from Guyana (7.1%, a difference of 0.12%), Houma (7.1%, a difference of 0.15%), Immigrants from Barbados (7.1%, a difference of 0.36%), and Immigrants from Dominica (7.0%, a difference of 1.6%).
| Demographics | Rating | Rank | Male Unemployment |
| Immigrants | Armenia | 0.0 /100 | #311 | Tragic 6.9% |
| Lumbee | 0.0 /100 | #312 | Tragic 6.9% |
| Immigrants | Dominica | 0.0 /100 | #313 | Tragic 7.0% |
| Immigrants | Barbados | 0.0 /100 | #314 | Tragic 7.1% |
| Houma | 0.0 /100 | #315 | Tragic 7.1% |
| Immigrants | Guyana | 0.0 /100 | #316 | Tragic 7.1% |
| Guyanese | 0.0 /100 | #317 | Tragic 7.1% |
| Cape Verdeans | 0.0 /100 | #318 | Tragic 7.1% |
| British West Indians | 0.0 /100 | #319 | Tragic 7.3% |
| Colville | 0.0 /100 | #320 | Tragic 7.4% |
| Immigrants | St. Vincent and the Grenadines | 0.0 /100 | #321 | Tragic 7.5% |
| Immigrants | Cabo Verde | 0.0 /100 | #322 | Tragic 7.5% |
| Immigrants | Grenada | 0.0 /100 | #323 | Tragic 7.6% |
| Dominicans | 0.0 /100 | #324 | Tragic 7.6% |
| Shoshone | 0.0 /100 | #325 | Tragic 7.6% |
Demographics Similar to Immigrants from South America by Male Unemployment
In terms of male unemployment, the demographic groups most similar to Immigrants from South America are Immigrants from Uganda (5.4%, a difference of 0.040%), Arab (5.4%, a difference of 0.060%), Immigrants from South Eastern Asia (5.4%, a difference of 0.080%), Costa Rican (5.4%, a difference of 0.13%), and Iraqi (5.4%, a difference of 0.15%).
| Demographics | Rating | Rank | Male Unemployment |
| Potawatomi | 37.8 /100 | #182 | Fair 5.3% |
| Taiwanese | 37.6 /100 | #183 | Fair 5.3% |
| Spaniards | 35.1 /100 | #184 | Fair 5.3% |
| Koreans | 34.9 /100 | #185 | Fair 5.3% |
| Iraqis | 31.6 /100 | #186 | Fair 5.4% |
| Costa Ricans | 31.3 /100 | #187 | Fair 5.4% |
| Arabs | 30.2 /100 | #188 | Fair 5.4% |
| Immigrants | South America | 29.4 /100 | #189 | Fair 5.4% |
| Immigrants | Uganda | 28.8 /100 | #190 | Fair 5.4% |
| Immigrants | South Eastern Asia | 28.2 /100 | #191 | Fair 5.4% |
| Immigrants | Belarus | 26.0 /100 | #192 | Fair 5.4% |
| Immigrants | Israel | 25.2 /100 | #193 | Fair 5.4% |
| Spanish | 19.7 /100 | #194 | Poor 5.4% |
| Immigrants | Southern Europe | 17.7 /100 | #195 | Poor 5.4% |
| Albanians | 17.3 /100 | #196 | Poor 5.4% |