Choctaw vs Inupiat Divorced or Separated
COMPARE
Choctaw
Inupiat
Divorced or Separated
Divorced or Separated Comparison
Choctaw
Inupiat
14.1%
DIVORCED OR SEPARATED
0.0/ 100
METRIC RATING
338th/ 347
METRIC RANK
11.4%
DIVORCED OR SEPARATED
99.8/ 100
METRIC RATING
66th/ 347
METRIC RANK
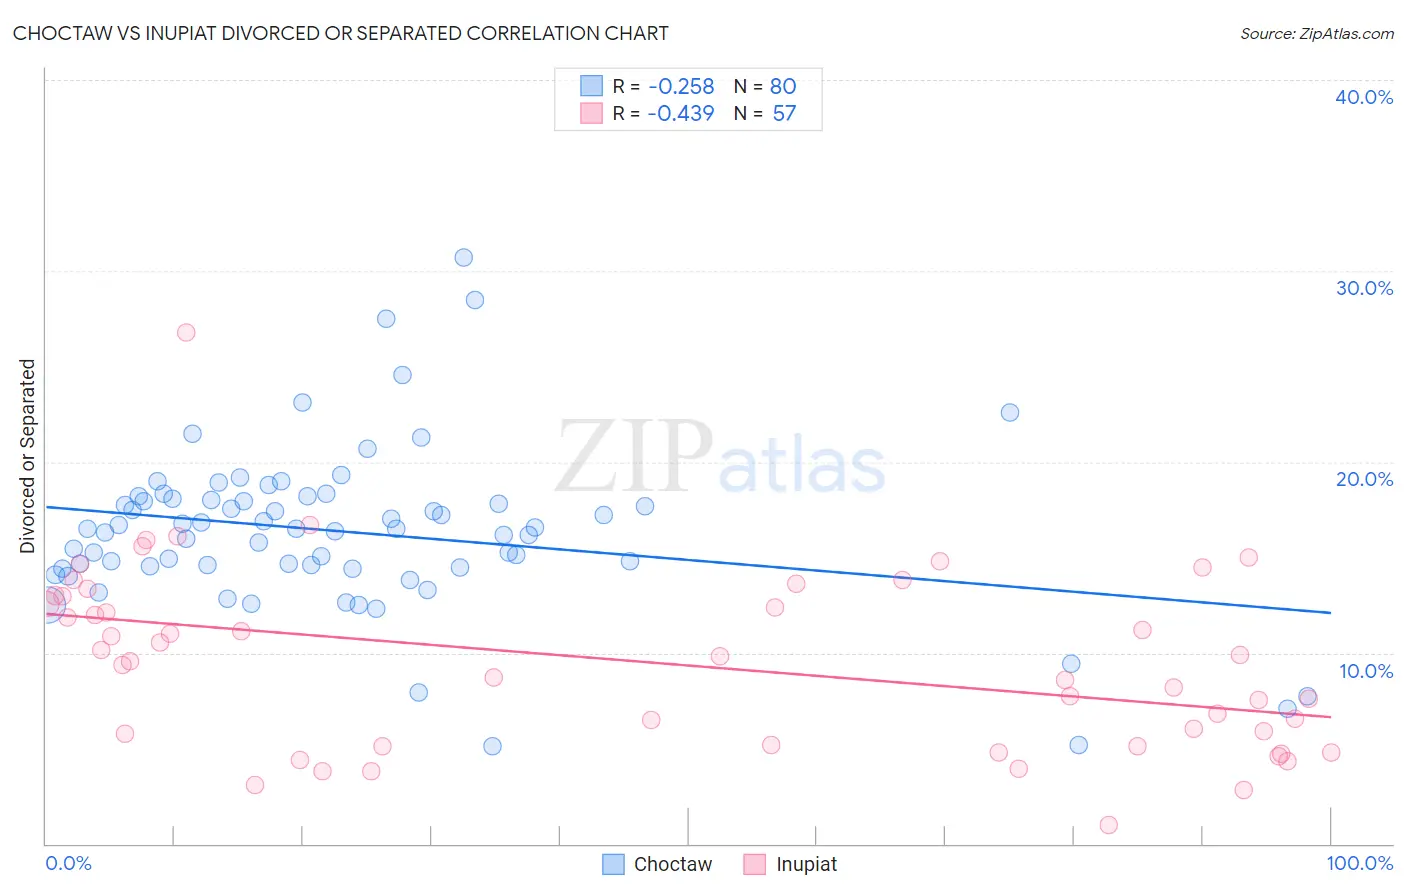
Choctaw vs Inupiat Divorced or Separated Correlation Chart
The statistical analysis conducted on geographies consisting of 269,698,992 people shows a weak negative correlation between the proportion of Choctaw and percentage of population currently divorced or separated in the United States with a correlation coefficient (R) of -0.258 and weighted average of 14.1%. Similarly, the statistical analysis conducted on geographies consisting of 96,343,887 people shows a moderate negative correlation between the proportion of Inupiat and percentage of population currently divorced or separated in the United States with a correlation coefficient (R) of -0.439 and weighted average of 11.4%, a difference of 23.6%.
Divorced or Separated Correlation Summary
| Measurement | Choctaw | Inupiat |
| Minimum | 5.1% | 1.0% |
| Maximum | 30.7% | 26.8% |
| Range | 25.6% | 25.8% |
| Mean | 16.3% | 9.5% |
| Median | 16.5% | 9.6% |
| Interquartile 25% (IQ1) | 14.5% | 5.2% |
| Interquartile 75% (IQ3) | 18.0% | 13.0% |
| Interquartile Range (IQR) | 3.5% | 7.8% |
| Standard Deviation (Sample) | 4.3% | 4.7% |
| Standard Deviation (Population) | 4.3% | 4.7% |
Similar Demographics by Divorced or Separated
Demographics Similar to Choctaw by Divorced or Separated
In terms of divorced or separated, the demographic groups most similar to Choctaw are Crow (14.1%, a difference of 0.31%), Colville (14.2%, a difference of 0.53%), Chickasaw (14.2%, a difference of 0.57%), Shoshone (14.0%, a difference of 0.60%), and Bahamian (14.2%, a difference of 0.77%).
| Demographics | Rating | Rank | Divorced or Separated |
| Blacks/African Americans | 0.0 /100 | #331 | Tragic 13.6% |
| Cherokee | 0.0 /100 | #332 | Tragic 13.7% |
| Puerto Ricans | 0.0 /100 | #333 | Tragic 13.9% |
| Immigrants | Bahamas | 0.0 /100 | #334 | Tragic 13.9% |
| Dutch West Indians | 0.0 /100 | #335 | Tragic 14.0% |
| Shoshone | 0.0 /100 | #336 | Tragic 14.0% |
| Crow | 0.0 /100 | #337 | Tragic 14.1% |
| Choctaw | 0.0 /100 | #338 | Tragic 14.1% |
| Colville | 0.0 /100 | #339 | Tragic 14.2% |
| Chickasaw | 0.0 /100 | #340 | Tragic 14.2% |
| Bahamians | 0.0 /100 | #341 | Tragic 14.2% |
| Seminole | 0.0 /100 | #342 | Tragic 14.3% |
| Creek | 0.0 /100 | #343 | Tragic 14.4% |
| Cubans | 0.0 /100 | #344 | Tragic 14.5% |
| Kiowa | 0.0 /100 | #345 | Tragic 14.5% |
Demographics Similar to Inupiat by Divorced or Separated
In terms of divorced or separated, the demographic groups most similar to Inupiat are Immigrants from Syria (11.4%, a difference of 0.090%), Immigrants from South Eastern Asia (11.4%, a difference of 0.14%), Macedonian (11.4%, a difference of 0.18%), Palestinian (11.5%, a difference of 0.20%), and Immigrants from Belgium (11.5%, a difference of 0.21%).
| Demographics | Rating | Rank | Divorced or Separated |
| Israelis | 99.9 /100 | #59 | Exceptional 11.3% |
| Immigrants | Russia | 99.9 /100 | #60 | Exceptional 11.3% |
| Koreans | 99.9 /100 | #61 | Exceptional 11.3% |
| Luxembourgers | 99.9 /100 | #62 | Exceptional 11.3% |
| Immigrants | Kuwait | 99.9 /100 | #63 | Exceptional 11.3% |
| Macedonians | 99.8 /100 | #64 | Exceptional 11.4% |
| Immigrants | South Eastern Asia | 99.8 /100 | #65 | Exceptional 11.4% |
| Inupiat | 99.8 /100 | #66 | Exceptional 11.4% |
| Immigrants | Syria | 99.7 /100 | #67 | Exceptional 11.4% |
| Palestinians | 99.7 /100 | #68 | Exceptional 11.5% |
| Immigrants | Belgium | 99.7 /100 | #69 | Exceptional 11.5% |
| Immigrants | Eastern Europe | 99.7 /100 | #70 | Exceptional 11.5% |
| Paraguayans | 99.7 /100 | #71 | Exceptional 11.5% |
| Jordanians | 99.6 /100 | #72 | Exceptional 11.5% |
| Immigrants | North Macedonia | 99.6 /100 | #73 | Exceptional 11.5% |