Ute vs Inupiat Divorced or Separated
COMPARE
Ute
Inupiat
Divorced or Separated
Divorced or Separated Comparison
Ute
Inupiat
12.6%
DIVORCED OR SEPARATED
0.4/ 100
METRIC RATING
270th/ 347
METRIC RANK
11.4%
DIVORCED OR SEPARATED
99.8/ 100
METRIC RATING
66th/ 347
METRIC RANK
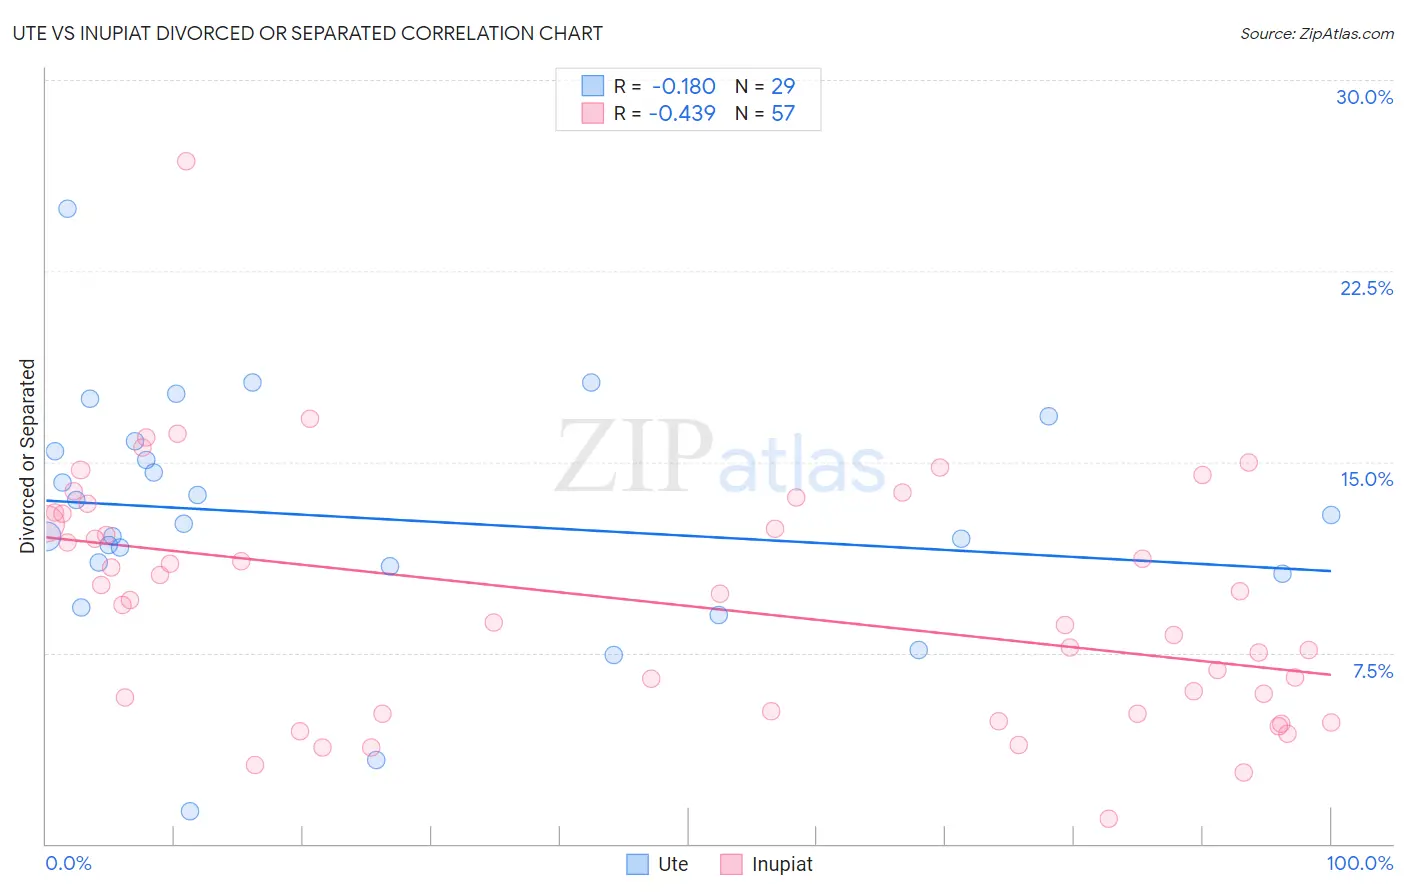
Ute vs Inupiat Divorced or Separated Correlation Chart
The statistical analysis conducted on geographies consisting of 55,667,313 people shows a poor negative correlation between the proportion of Ute and percentage of population currently divorced or separated in the United States with a correlation coefficient (R) of -0.180 and weighted average of 12.6%. Similarly, the statistical analysis conducted on geographies consisting of 96,343,887 people shows a moderate negative correlation between the proportion of Inupiat and percentage of population currently divorced or separated in the United States with a correlation coefficient (R) of -0.439 and weighted average of 11.4%, a difference of 10.6%.
Divorced or Separated Correlation Summary
| Measurement | Ute | Inupiat |
| Minimum | 1.3% | 1.0% |
| Maximum | 24.9% | 26.8% |
| Range | 23.6% | 25.8% |
| Mean | 12.8% | 9.5% |
| Median | 12.6% | 9.6% |
| Interquartile 25% (IQ1) | 10.7% | 5.2% |
| Interquartile 75% (IQ3) | 15.6% | 13.0% |
| Interquartile Range (IQR) | 4.9% | 7.8% |
| Standard Deviation (Sample) | 4.7% | 4.7% |
| Standard Deviation (Population) | 4.6% | 4.7% |
Similar Demographics by Divorced or Separated
Demographics Similar to Ute by Divorced or Separated
In terms of divorced or separated, the demographic groups most similar to Ute are Panamanian (12.7%, a difference of 0.060%), Immigrants from Middle Africa (12.7%, a difference of 0.11%), Immigrants from Liberia (12.6%, a difference of 0.12%), Fijian (12.6%, a difference of 0.13%), and Scottish (12.6%, a difference of 0.14%).
| Demographics | Rating | Rank | Divorced or Separated |
| Immigrants | Panama | 0.5 /100 | #263 | Tragic 12.6% |
| English | 0.5 /100 | #264 | Tragic 12.6% |
| Immigrants | Senegal | 0.5 /100 | #265 | Tragic 12.6% |
| Whites/Caucasians | 0.5 /100 | #266 | Tragic 12.6% |
| Scottish | 0.4 /100 | #267 | Tragic 12.6% |
| Fijians | 0.4 /100 | #268 | Tragic 12.6% |
| Immigrants | Liberia | 0.4 /100 | #269 | Tragic 12.6% |
| Ute | 0.4 /100 | #270 | Tragic 12.6% |
| Panamanians | 0.3 /100 | #271 | Tragic 12.7% |
| Immigrants | Middle Africa | 0.3 /100 | #272 | Tragic 12.7% |
| Immigrants | Micronesia | 0.3 /100 | #273 | Tragic 12.7% |
| Bermudans | 0.3 /100 | #274 | Tragic 12.7% |
| Central American Indians | 0.3 /100 | #275 | Tragic 12.7% |
| Spaniards | 0.2 /100 | #276 | Tragic 12.7% |
| Dominicans | 0.2 /100 | #277 | Tragic 12.7% |
Demographics Similar to Inupiat by Divorced or Separated
In terms of divorced or separated, the demographic groups most similar to Inupiat are Immigrants from Syria (11.4%, a difference of 0.090%), Immigrants from South Eastern Asia (11.4%, a difference of 0.14%), Macedonian (11.4%, a difference of 0.18%), Palestinian (11.5%, a difference of 0.20%), and Immigrants from Belgium (11.5%, a difference of 0.21%).
| Demographics | Rating | Rank | Divorced or Separated |
| Israelis | 99.9 /100 | #59 | Exceptional 11.3% |
| Immigrants | Russia | 99.9 /100 | #60 | Exceptional 11.3% |
| Koreans | 99.9 /100 | #61 | Exceptional 11.3% |
| Luxembourgers | 99.9 /100 | #62 | Exceptional 11.3% |
| Immigrants | Kuwait | 99.9 /100 | #63 | Exceptional 11.3% |
| Macedonians | 99.8 /100 | #64 | Exceptional 11.4% |
| Immigrants | South Eastern Asia | 99.8 /100 | #65 | Exceptional 11.4% |
| Inupiat | 99.8 /100 | #66 | Exceptional 11.4% |
| Immigrants | Syria | 99.7 /100 | #67 | Exceptional 11.4% |
| Palestinians | 99.7 /100 | #68 | Exceptional 11.5% |
| Immigrants | Belgium | 99.7 /100 | #69 | Exceptional 11.5% |
| Immigrants | Eastern Europe | 99.7 /100 | #70 | Exceptional 11.5% |
| Paraguayans | 99.7 /100 | #71 | Exceptional 11.5% |
| Jordanians | 99.6 /100 | #72 | Exceptional 11.5% |
| Immigrants | North Macedonia | 99.6 /100 | #73 | Exceptional 11.5% |