Creek vs Immigrants from West Indies Currently Married
COMPARE
Creek
Immigrants from West Indies
Currently Married
Currently Married Comparison
Creek
Immigrants from West Indies
46.0%
CURRENTLY MARRIED
17.2/ 100
METRIC RATING
200th/ 347
METRIC RANK
40.7%
CURRENTLY MARRIED
0.0/ 100
METRIC RATING
323rd/ 347
METRIC RANK
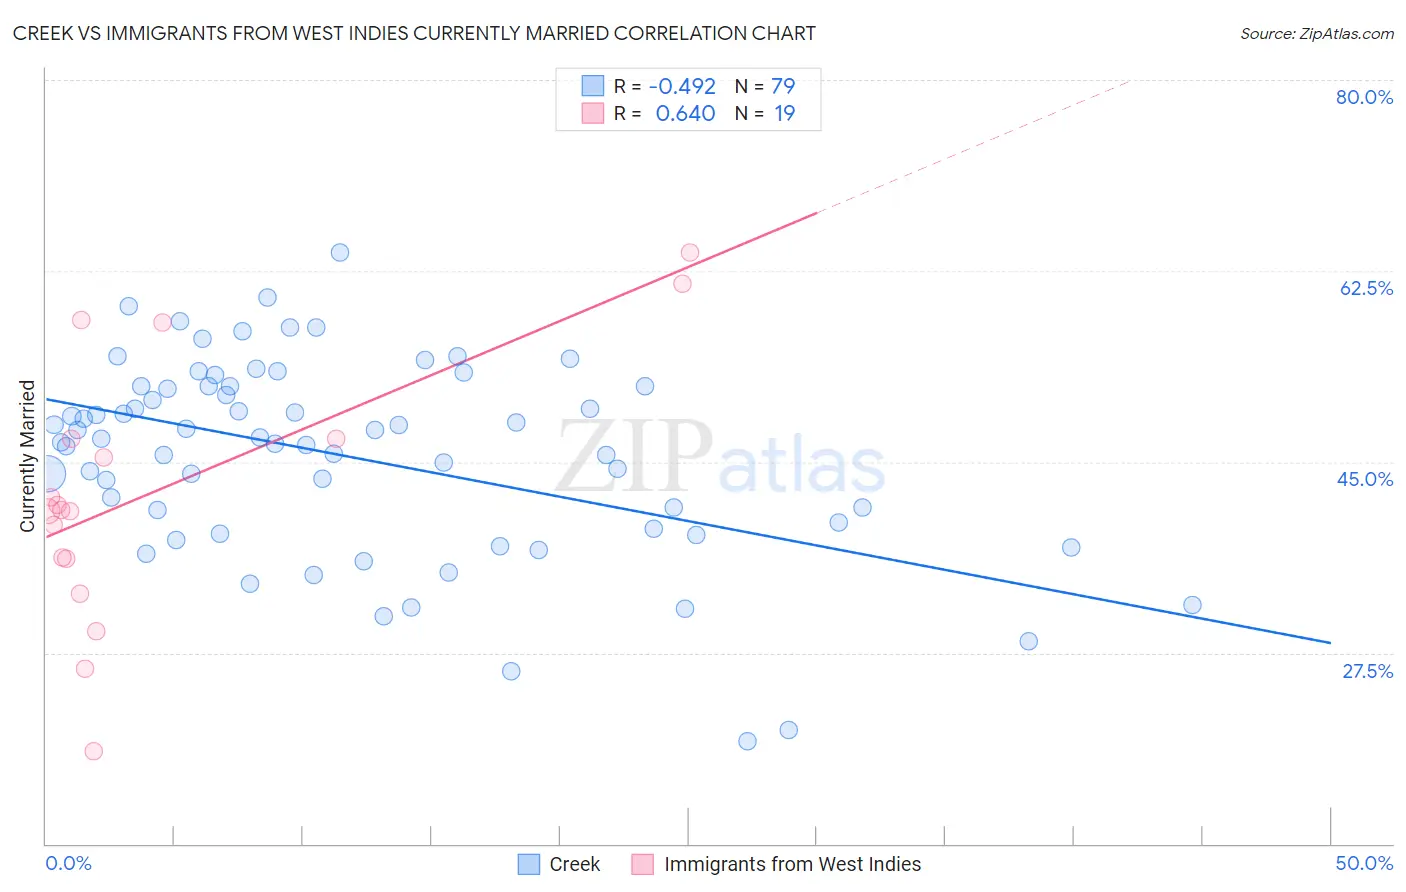
Creek vs Immigrants from West Indies Currently Married Correlation Chart
The statistical analysis conducted on geographies consisting of 178,480,718 people shows a moderate negative correlation between the proportion of Creek and percentage of population currently married in the United States with a correlation coefficient (R) of -0.492 and weighted average of 46.0%. Similarly, the statistical analysis conducted on geographies consisting of 72,457,514 people shows a significant positive correlation between the proportion of Immigrants from West Indies and percentage of population currently married in the United States with a correlation coefficient (R) of 0.640 and weighted average of 40.7%, a difference of 12.9%.
Currently Married Correlation Summary
| Measurement | Creek | Immigrants from West Indies |
| Minimum | 19.4% | 18.5% |
| Maximum | 64.2% | 64.2% |
| Range | 44.8% | 45.7% |
| Mean | 45.4% | 42.3% |
| Median | 47.1% | 40.6% |
| Interquartile 25% (IQ1) | 38.8% | 36.1% |
| Interquartile 75% (IQ3) | 51.9% | 47.1% |
| Interquartile Range (IQR) | 13.1% | 11.0% |
| Standard Deviation (Sample) | 9.0% | 11.9% |
| Standard Deviation (Population) | 9.0% | 11.6% |
Similar Demographics by Currently Married
Demographics Similar to Creek by Currently Married
In terms of currently married, the demographic groups most similar to Creek are Malaysian (45.9%, a difference of 0.13%), Immigrants from Costa Rica (46.0%, a difference of 0.14%), Immigrants from Albania (45.9%, a difference of 0.19%), Immigrants from Colombia (46.1%, a difference of 0.22%), and Immigrants from Kuwait (46.1%, a difference of 0.26%).
| Demographics | Rating | Rank | Currently Married |
| Immigrants | Fiji | 25.0 /100 | #193 | Fair 46.2% |
| South Americans | 23.8 /100 | #194 | Fair 46.1% |
| Immigrants | Nepal | 23.7 /100 | #195 | Fair 46.1% |
| Immigrants | Bosnia and Herzegovina | 22.2 /100 | #196 | Fair 46.1% |
| Immigrants | Kuwait | 21.7 /100 | #197 | Fair 46.1% |
| Immigrants | Colombia | 21.0 /100 | #198 | Fair 46.1% |
| Immigrants | Costa Rica | 19.6 /100 | #199 | Poor 46.0% |
| Creek | 17.2 /100 | #200 | Poor 46.0% |
| Malaysians | 15.3 /100 | #201 | Poor 45.9% |
| Immigrants | Albania | 14.5 /100 | #202 | Poor 45.9% |
| Taiwanese | 11.7 /100 | #203 | Poor 45.8% |
| Immigrants | Spain | 11.6 /100 | #204 | Poor 45.8% |
| South American Indians | 11.5 /100 | #205 | Poor 45.8% |
| Immigrants | Immigrants | 11.2 /100 | #206 | Poor 45.8% |
| Immigrants | South America | 10.8 /100 | #207 | Poor 45.7% |
Demographics Similar to Immigrants from West Indies by Currently Married
In terms of currently married, the demographic groups most similar to Immigrants from West Indies are Immigrants from Senegal (40.7%, a difference of 0.010%), U.S. Virgin Islander (40.7%, a difference of 0.060%), Barbadian (40.6%, a difference of 0.20%), Senegalese (40.6%, a difference of 0.37%), and Arapaho (40.5%, a difference of 0.41%).
| Demographics | Rating | Rank | Currently Married |
| Immigrants | Caribbean | 0.0 /100 | #316 | Tragic 41.3% |
| Haitians | 0.0 /100 | #317 | Tragic 41.3% |
| Bahamians | 0.0 /100 | #318 | Tragic 41.2% |
| Immigrants | Somalia | 0.0 /100 | #319 | Tragic 41.2% |
| Immigrants | Jamaica | 0.0 /100 | #320 | Tragic 41.1% |
| Immigrants | Congo | 0.0 /100 | #321 | Tragic 41.1% |
| Immigrants | Haiti | 0.0 /100 | #322 | Tragic 41.0% |
| Immigrants | West Indies | 0.0 /100 | #323 | Tragic 40.7% |
| Immigrants | Senegal | 0.0 /100 | #324 | Tragic 40.7% |
| U.S. Virgin Islanders | 0.0 /100 | #325 | Tragic 40.7% |
| Barbadians | 0.0 /100 | #326 | Tragic 40.6% |
| Senegalese | 0.0 /100 | #327 | Tragic 40.6% |
| Arapaho | 0.0 /100 | #328 | Tragic 40.5% |
| Crow | 0.0 /100 | #329 | Tragic 40.4% |
| Immigrants | Dominica | 0.0 /100 | #330 | Tragic 40.3% |