Honduran vs Immigrants from West Indies Currently Married
COMPARE
Honduran
Immigrants from West Indies
Currently Married
Currently Married Comparison
Hondurans
Immigrants from West Indies
42.5%
CURRENTLY MARRIED
0.0/ 100
METRIC RATING
294th/ 347
METRIC RANK
40.7%
CURRENTLY MARRIED
0.0/ 100
METRIC RATING
323rd/ 347
METRIC RANK
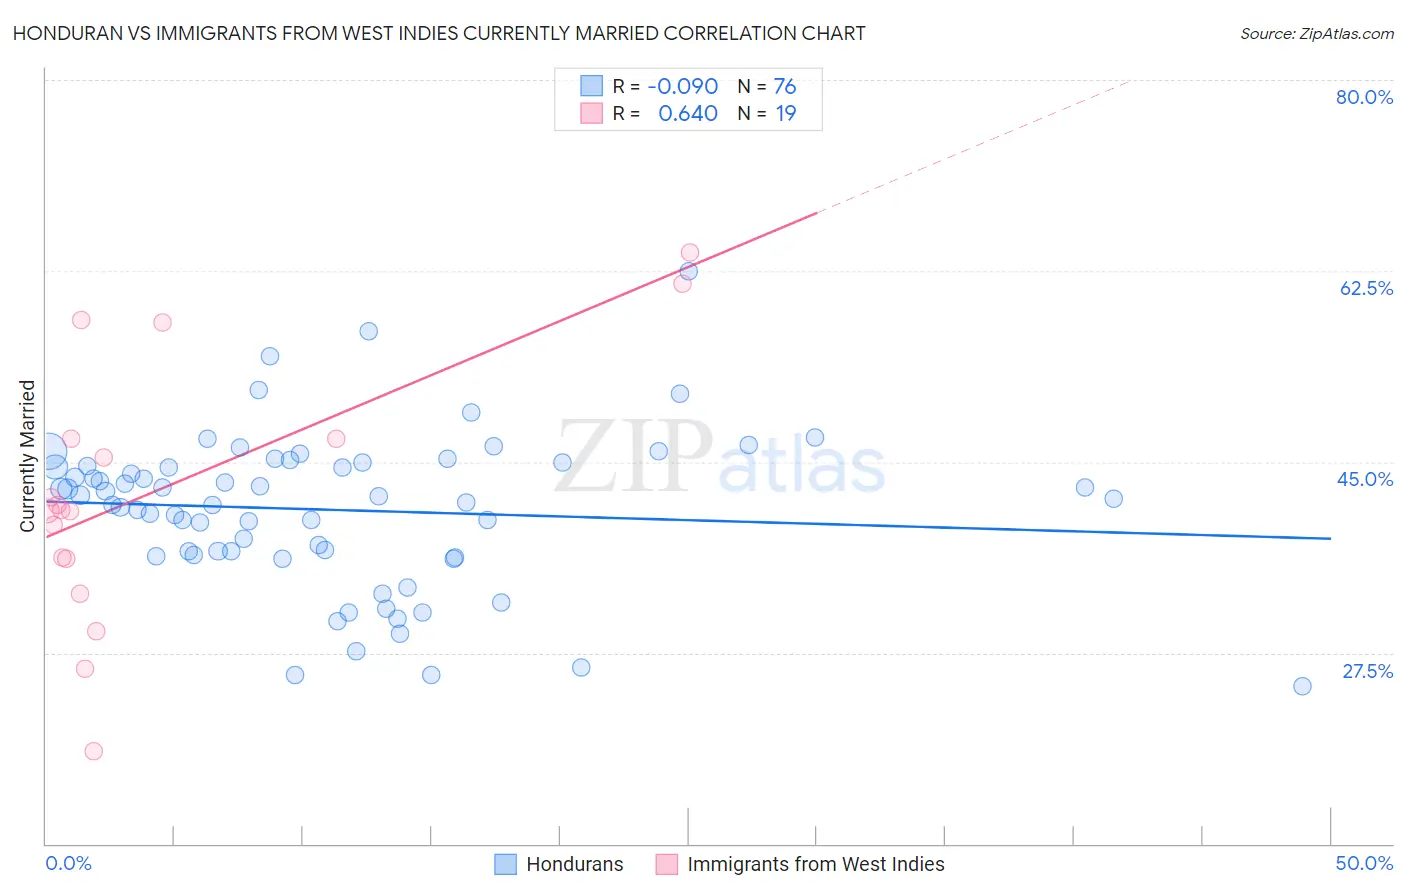
Honduran vs Immigrants from West Indies Currently Married Correlation Chart
The statistical analysis conducted on geographies consisting of 357,812,977 people shows a slight negative correlation between the proportion of Hondurans and percentage of population currently married in the United States with a correlation coefficient (R) of -0.090 and weighted average of 42.5%. Similarly, the statistical analysis conducted on geographies consisting of 72,457,514 people shows a significant positive correlation between the proportion of Immigrants from West Indies and percentage of population currently married in the United States with a correlation coefficient (R) of 0.640 and weighted average of 40.7%, a difference of 4.4%.
Currently Married Correlation Summary
| Measurement | Honduran | Immigrants from West Indies |
| Minimum | 24.4% | 18.5% |
| Maximum | 62.5% | 64.2% |
| Range | 38.1% | 45.7% |
| Mean | 40.6% | 42.3% |
| Median | 41.7% | 40.6% |
| Interquartile 25% (IQ1) | 36.6% | 36.1% |
| Interquartile 75% (IQ3) | 44.7% | 47.1% |
| Interquartile Range (IQR) | 8.1% | 11.0% |
| Standard Deviation (Sample) | 7.1% | 11.9% |
| Standard Deviation (Population) | 7.1% | 11.6% |
Similar Demographics by Currently Married
Demographics Similar to Hondurans by Currently Married
In terms of currently married, the demographic groups most similar to Hondurans are Yuman (42.6%, a difference of 0.12%), Subsaharan African (42.6%, a difference of 0.14%), Immigrants from Guatemala (42.6%, a difference of 0.30%), Immigrants from Western Africa (42.4%, a difference of 0.33%), and Immigrants from Ghana (42.7%, a difference of 0.41%).
| Demographics | Rating | Rank | Currently Married |
| Guatemalans | 0.0 /100 | #287 | Tragic 42.9% |
| Natives/Alaskans | 0.0 /100 | #288 | Tragic 42.8% |
| Paiute | 0.0 /100 | #289 | Tragic 42.7% |
| Immigrants | Ghana | 0.0 /100 | #290 | Tragic 42.7% |
| Immigrants | Guatemala | 0.0 /100 | #291 | Tragic 42.6% |
| Sub-Saharan Africans | 0.0 /100 | #292 | Tragic 42.6% |
| Yuman | 0.0 /100 | #293 | Tragic 42.6% |
| Hondurans | 0.0 /100 | #294 | Tragic 42.5% |
| Immigrants | Western Africa | 0.0 /100 | #295 | Tragic 42.4% |
| Menominee | 0.0 /100 | #296 | Tragic 42.3% |
| Cheyenne | 0.0 /100 | #297 | Tragic 42.2% |
| Immigrants | Honduras | 0.0 /100 | #298 | Tragic 42.2% |
| Liberians | 0.0 /100 | #299 | Tragic 42.2% |
| Belizeans | 0.0 /100 | #300 | Tragic 42.2% |
| Immigrants | Yemen | 0.0 /100 | #301 | Tragic 42.1% |
Demographics Similar to Immigrants from West Indies by Currently Married
In terms of currently married, the demographic groups most similar to Immigrants from West Indies are Immigrants from Senegal (40.7%, a difference of 0.010%), U.S. Virgin Islander (40.7%, a difference of 0.060%), Barbadian (40.6%, a difference of 0.20%), Senegalese (40.6%, a difference of 0.37%), and Arapaho (40.5%, a difference of 0.41%).
| Demographics | Rating | Rank | Currently Married |
| Immigrants | Caribbean | 0.0 /100 | #316 | Tragic 41.3% |
| Haitians | 0.0 /100 | #317 | Tragic 41.3% |
| Bahamians | 0.0 /100 | #318 | Tragic 41.2% |
| Immigrants | Somalia | 0.0 /100 | #319 | Tragic 41.2% |
| Immigrants | Jamaica | 0.0 /100 | #320 | Tragic 41.1% |
| Immigrants | Congo | 0.0 /100 | #321 | Tragic 41.1% |
| Immigrants | Haiti | 0.0 /100 | #322 | Tragic 41.0% |
| Immigrants | West Indies | 0.0 /100 | #323 | Tragic 40.7% |
| Immigrants | Senegal | 0.0 /100 | #324 | Tragic 40.7% |
| U.S. Virgin Islanders | 0.0 /100 | #325 | Tragic 40.7% |
| Barbadians | 0.0 /100 | #326 | Tragic 40.6% |
| Senegalese | 0.0 /100 | #327 | Tragic 40.6% |
| Arapaho | 0.0 /100 | #328 | Tragic 40.5% |
| Crow | 0.0 /100 | #329 | Tragic 40.4% |
| Immigrants | Dominica | 0.0 /100 | #330 | Tragic 40.3% |