Navajo vs Immigrants from West Indies Currently Married
COMPARE
Navajo
Immigrants from West Indies
Currently Married
Currently Married Comparison
Navajo
Immigrants from West Indies
39.0%
CURRENTLY MARRIED
0.0/ 100
METRIC RATING
341st/ 347
METRIC RANK
40.7%
CURRENTLY MARRIED
0.0/ 100
METRIC RATING
323rd/ 347
METRIC RANK
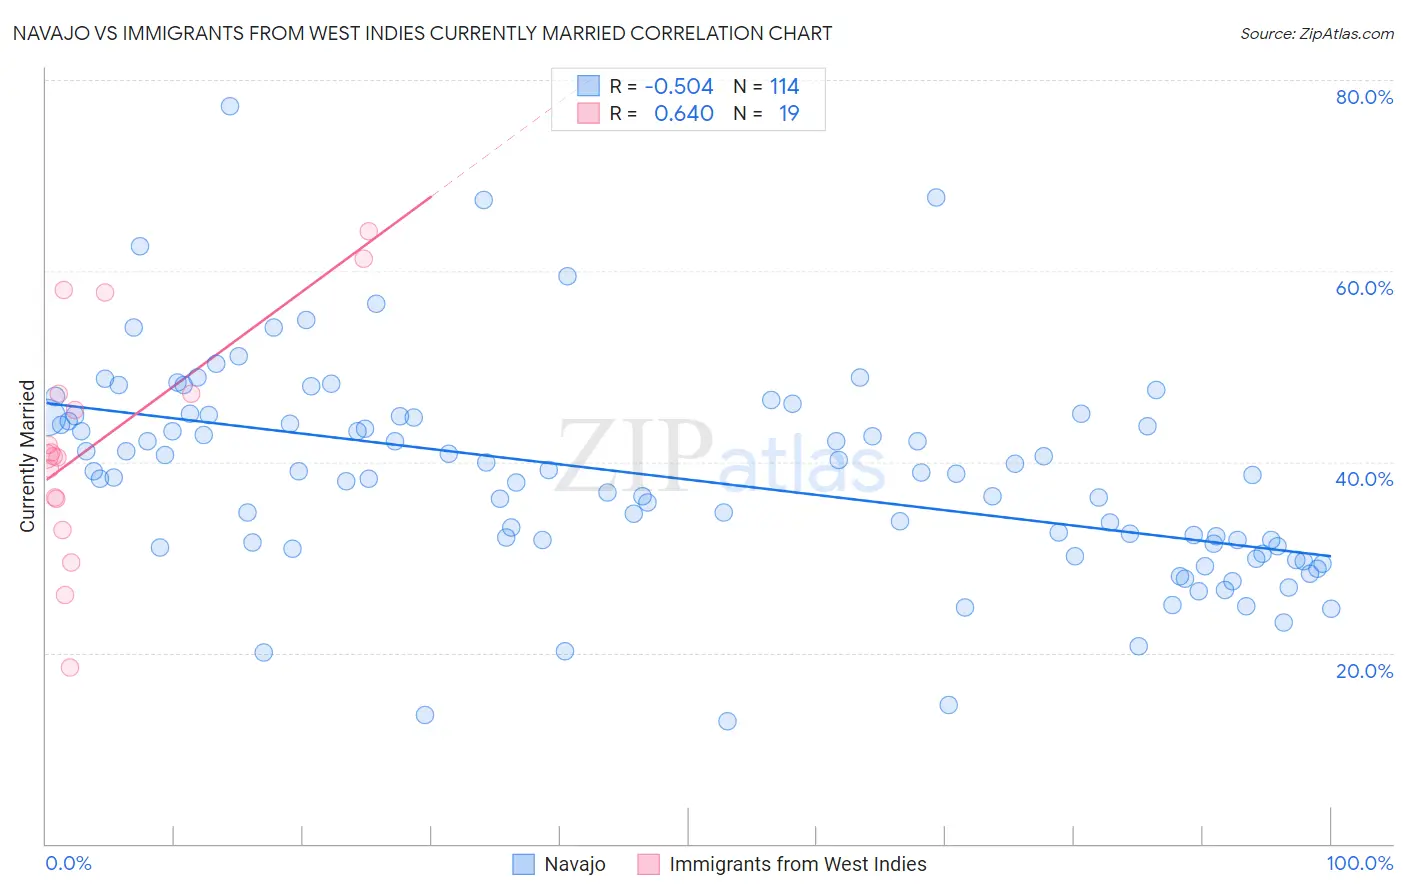
Navajo vs Immigrants from West Indies Currently Married Correlation Chart
The statistical analysis conducted on geographies consisting of 224,862,150 people shows a substantial negative correlation between the proportion of Navajo and percentage of population currently married in the United States with a correlation coefficient (R) of -0.504 and weighted average of 39.0%. Similarly, the statistical analysis conducted on geographies consisting of 72,457,514 people shows a significant positive correlation between the proportion of Immigrants from West Indies and percentage of population currently married in the United States with a correlation coefficient (R) of 0.640 and weighted average of 40.7%, a difference of 4.4%.
Currently Married Correlation Summary
| Measurement | Navajo | Immigrants from West Indies |
| Minimum | 12.8% | 18.5% |
| Maximum | 77.3% | 64.2% |
| Range | 64.5% | 45.7% |
| Mean | 38.4% | 42.3% |
| Median | 38.7% | 40.6% |
| Interquartile 25% (IQ1) | 31.1% | 36.1% |
| Interquartile 75% (IQ3) | 44.6% | 47.1% |
| Interquartile Range (IQR) | 13.5% | 11.0% |
| Standard Deviation (Sample) | 10.9% | 11.9% |
| Standard Deviation (Population) | 10.8% | 11.6% |
Demographics Similar to Navajo and Immigrants from West Indies by Currently Married
In terms of currently married, the demographic groups most similar to Navajo are Immigrants from Dominican Republic (38.9%, a difference of 0.17%), Immigrants from Grenada (39.1%, a difference of 0.35%), Dominican (39.5%, a difference of 1.3%), Cape Verdean (39.6%, a difference of 1.5%), and Black/African American (39.6%, a difference of 1.6%). Similarly, the demographic groups most similar to Immigrants from West Indies are Immigrants from Senegal (40.7%, a difference of 0.010%), U.S. Virgin Islander (40.7%, a difference of 0.060%), Barbadian (40.6%, a difference of 0.20%), Senegalese (40.6%, a difference of 0.37%), and Arapaho (40.5%, a difference of 0.41%).
| Demographics | Rating | Rank | Currently Married |
| Immigrants | Haiti | 0.0 /100 | #322 | Tragic 41.0% |
| Immigrants | West Indies | 0.0 /100 | #323 | Tragic 40.7% |
| Immigrants | Senegal | 0.0 /100 | #324 | Tragic 40.7% |
| U.S. Virgin Islanders | 0.0 /100 | #325 | Tragic 40.7% |
| Barbadians | 0.0 /100 | #326 | Tragic 40.6% |
| Senegalese | 0.0 /100 | #327 | Tragic 40.6% |
| Arapaho | 0.0 /100 | #328 | Tragic 40.5% |
| Crow | 0.0 /100 | #329 | Tragic 40.4% |
| Immigrants | Dominica | 0.0 /100 | #330 | Tragic 40.3% |
| Immigrants | Barbados | 0.0 /100 | #331 | Tragic 40.3% |
| Immigrants | St. Vincent and the Grenadines | 0.0 /100 | #332 | Tragic 40.1% |
| Yup'ik | 0.0 /100 | #333 | Tragic 39.9% |
| Puerto Ricans | 0.0 /100 | #334 | Tragic 39.9% |
| Lumbee | 0.0 /100 | #335 | Tragic 39.8% |
| British West Indians | 0.0 /100 | #336 | Tragic 39.8% |
| Blacks/African Americans | 0.0 /100 | #337 | Tragic 39.6% |
| Cape Verdeans | 0.0 /100 | #338 | Tragic 39.6% |
| Dominicans | 0.0 /100 | #339 | Tragic 39.5% |
| Immigrants | Grenada | 0.0 /100 | #340 | Tragic 39.1% |
| Navajo | 0.0 /100 | #341 | Tragic 39.0% |
| Immigrants | Dominican Republic | 0.0 /100 | #342 | Tragic 38.9% |