Immigrants from Europe vs Immigrants from West Indies Currently Married
COMPARE
Immigrants from Europe
Immigrants from West Indies
Currently Married
Currently Married Comparison
Immigrants from Europe
Immigrants from West Indies
48.1%
CURRENTLY MARRIED
96.9/ 100
METRIC RATING
82nd/ 347
METRIC RANK
40.7%
CURRENTLY MARRIED
0.0/ 100
METRIC RATING
323rd/ 347
METRIC RANK
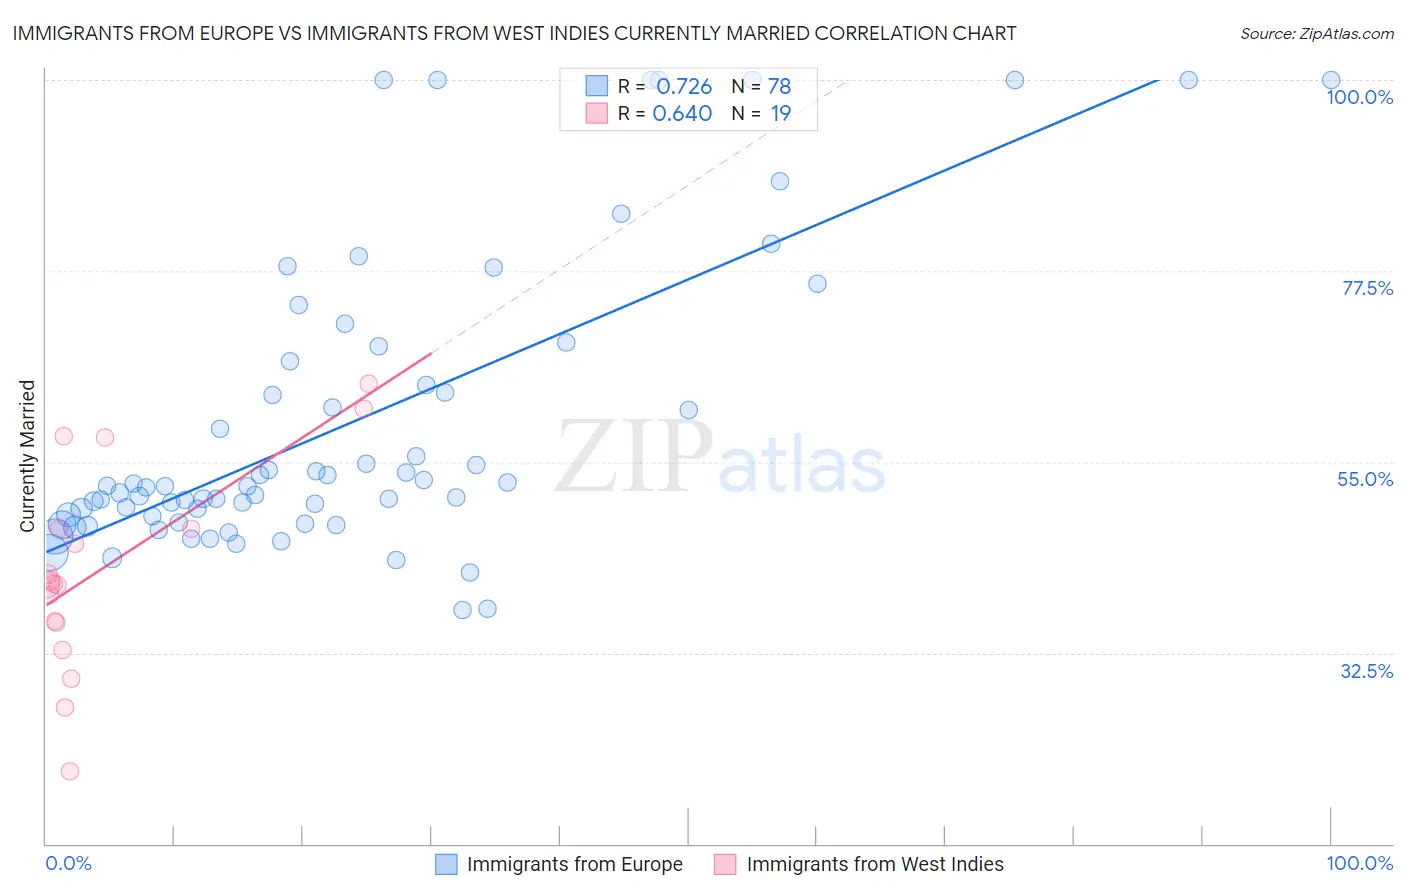
Immigrants from Europe vs Immigrants from West Indies Currently Married Correlation Chart
The statistical analysis conducted on geographies consisting of 547,318,007 people shows a strong positive correlation between the proportion of Immigrants from Europe and percentage of population currently married in the United States with a correlation coefficient (R) of 0.726 and weighted average of 48.1%. Similarly, the statistical analysis conducted on geographies consisting of 72,457,514 people shows a significant positive correlation between the proportion of Immigrants from West Indies and percentage of population currently married in the United States with a correlation coefficient (R) of 0.640 and weighted average of 40.7%, a difference of 18.1%.
Currently Married Correlation Summary
| Measurement | Immigrants from Europe | Immigrants from West Indies |
| Minimum | 37.5% | 18.5% |
| Maximum | 100.0% | 64.2% |
| Range | 62.5% | 45.7% |
| Mean | 59.6% | 42.3% |
| Median | 52.1% | 40.6% |
| Interquartile 25% (IQ1) | 48.6% | 36.1% |
| Interquartile 75% (IQ3) | 66.9% | 47.1% |
| Interquartile Range (IQR) | 18.3% | 11.0% |
| Standard Deviation (Sample) | 17.4% | 11.9% |
| Standard Deviation (Population) | 17.3% | 11.6% |
Similar Demographics by Currently Married
Demographics Similar to Immigrants from Europe by Currently Married
In terms of currently married, the demographic groups most similar to Immigrants from Europe are Immigrants from Sri Lanka (48.1%, a difference of 0.0%), Immigrants from Poland (48.1%, a difference of 0.010%), Bolivian (48.1%, a difference of 0.010%), Immigrants from Israel (48.1%, a difference of 0.010%), and Immigrants from South Africa (48.1%, a difference of 0.040%).
| Demographics | Rating | Rank | Currently Married |
| Immigrants | Belarus | 97.2 /100 | #75 | Exceptional 48.1% |
| Basques | 97.2 /100 | #76 | Exceptional 48.1% |
| Slovenes | 97.1 /100 | #77 | Exceptional 48.1% |
| Immigrants | Belgium | 97.1 /100 | #78 | Exceptional 48.1% |
| Immigrants | South Africa | 97.0 /100 | #79 | Exceptional 48.1% |
| Immigrants | Poland | 96.9 /100 | #80 | Exceptional 48.1% |
| Immigrants | Sri Lanka | 96.9 /100 | #81 | Exceptional 48.1% |
| Immigrants | Europe | 96.9 /100 | #82 | Exceptional 48.1% |
| Bolivians | 96.9 /100 | #83 | Exceptional 48.1% |
| Immigrants | Israel | 96.9 /100 | #84 | Exceptional 48.1% |
| French Canadians | 96.3 /100 | #85 | Exceptional 48.0% |
| Immigrants | Japan | 96.2 /100 | #86 | Exceptional 48.0% |
| Jordanians | 96.2 /100 | #87 | Exceptional 48.0% |
| Immigrants | Eastern Europe | 96.1 /100 | #88 | Exceptional 48.0% |
| Indians (Asian) | 95.8 /100 | #89 | Exceptional 48.0% |
Demographics Similar to Immigrants from West Indies by Currently Married
In terms of currently married, the demographic groups most similar to Immigrants from West Indies are Immigrants from Senegal (40.7%, a difference of 0.010%), U.S. Virgin Islander (40.7%, a difference of 0.060%), Barbadian (40.6%, a difference of 0.20%), Senegalese (40.6%, a difference of 0.37%), and Arapaho (40.5%, a difference of 0.41%).
| Demographics | Rating | Rank | Currently Married |
| Immigrants | Caribbean | 0.0 /100 | #316 | Tragic 41.3% |
| Haitians | 0.0 /100 | #317 | Tragic 41.3% |
| Bahamians | 0.0 /100 | #318 | Tragic 41.2% |
| Immigrants | Somalia | 0.0 /100 | #319 | Tragic 41.2% |
| Immigrants | Jamaica | 0.0 /100 | #320 | Tragic 41.1% |
| Immigrants | Congo | 0.0 /100 | #321 | Tragic 41.1% |
| Immigrants | Haiti | 0.0 /100 | #322 | Tragic 41.0% |
| Immigrants | West Indies | 0.0 /100 | #323 | Tragic 40.7% |
| Immigrants | Senegal | 0.0 /100 | #324 | Tragic 40.7% |
| U.S. Virgin Islanders | 0.0 /100 | #325 | Tragic 40.7% |
| Barbadians | 0.0 /100 | #326 | Tragic 40.6% |
| Senegalese | 0.0 /100 | #327 | Tragic 40.6% |
| Arapaho | 0.0 /100 | #328 | Tragic 40.5% |
| Crow | 0.0 /100 | #329 | Tragic 40.4% |
| Immigrants | Dominica | 0.0 /100 | #330 | Tragic 40.3% |