Canadian vs Immigrants from Middle Africa 8th Grade
COMPARE
Canadian
Immigrants from Middle Africa
8th Grade
8th Grade Comparison
Canadians
Immigrants from Middle Africa
96.6%
8TH GRADE
99.7/ 100
METRIC RATING
66th/ 347
METRIC RANK
95.1%
8TH GRADE
1.7/ 100
METRIC RATING
244th/ 347
METRIC RANK
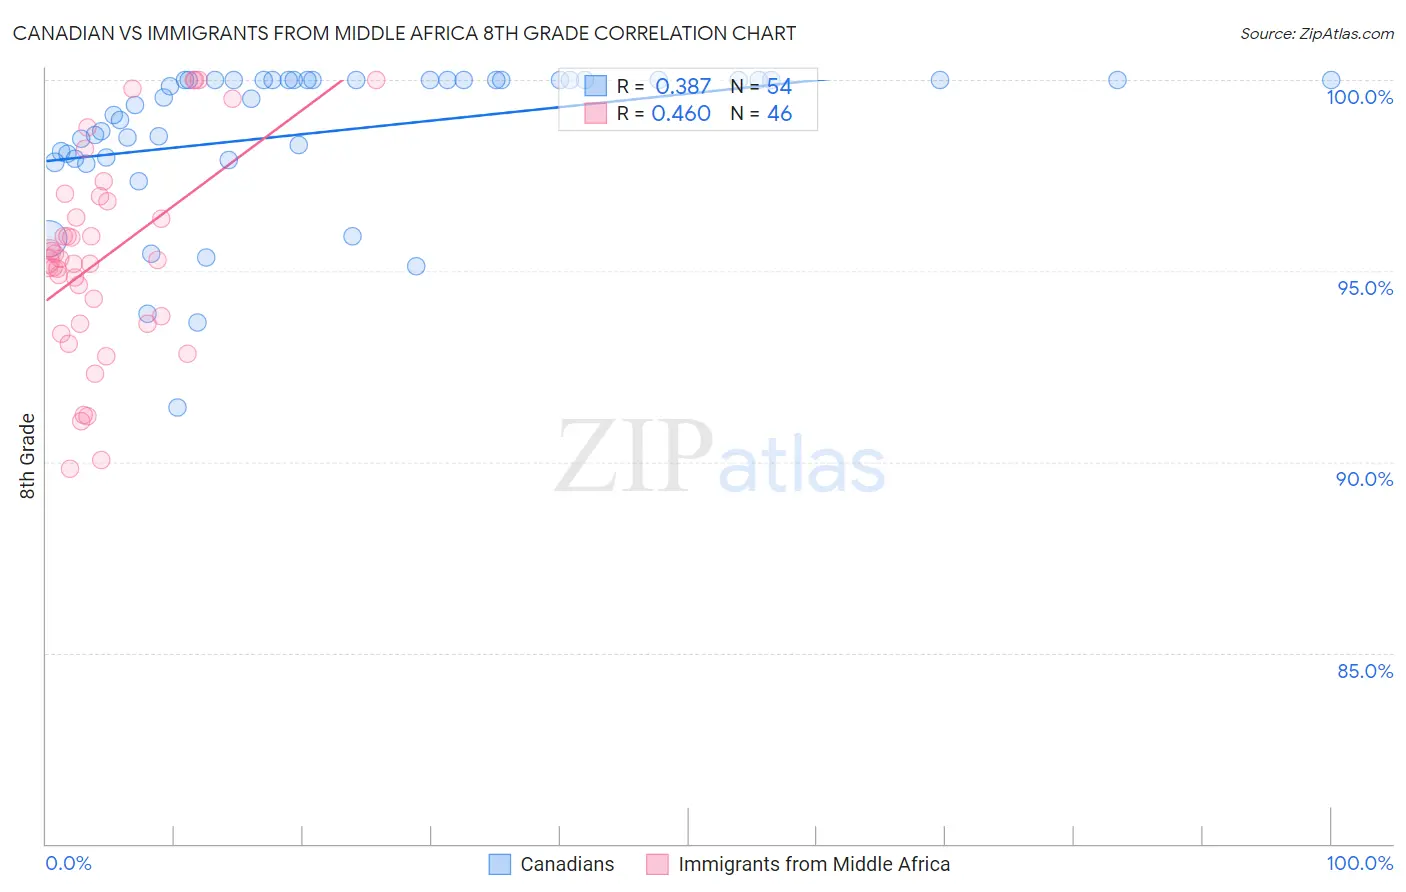
Canadian vs Immigrants from Middle Africa 8th Grade Correlation Chart
The statistical analysis conducted on geographies consisting of 437,556,929 people shows a mild positive correlation between the proportion of Canadians and percentage of population with at least 8th grade education in the United States with a correlation coefficient (R) of 0.387 and weighted average of 96.6%. Similarly, the statistical analysis conducted on geographies consisting of 202,699,867 people shows a moderate positive correlation between the proportion of Immigrants from Middle Africa and percentage of population with at least 8th grade education in the United States with a correlation coefficient (R) of 0.460 and weighted average of 95.1%, a difference of 1.6%.
8th Grade Correlation Summary
| Measurement | Canadian | Immigrants from Middle Africa |
| Minimum | 91.4% | 89.8% |
| Maximum | 100.0% | 100.0% |
| Range | 8.6% | 10.2% |
| Mean | 98.6% | 95.4% |
| Median | 99.7% | 95.3% |
| Interquartile 25% (IQ1) | 98.0% | 93.6% |
| Interquartile 75% (IQ3) | 100.0% | 96.8% |
| Interquartile Range (IQR) | 2.0% | 3.2% |
| Standard Deviation (Sample) | 2.0% | 2.6% |
| Standard Deviation (Population) | 1.9% | 2.6% |
Similar Demographics by 8th Grade
Demographics Similar to Canadians by 8th Grade
In terms of 8th grade, the demographic groups most similar to Canadians are Native Hawaiian (96.6%, a difference of 0.0%), Ukrainian (96.7%, a difference of 0.010%), Immigrants from India (96.6%, a difference of 0.010%), Iranian (96.6%, a difference of 0.010%), and White/Caucasian (96.7%, a difference of 0.020%).
| Demographics | Rating | Rank | 8th Grade |
| Immigrants | North America | 99.8 /100 | #59 | Exceptional 96.7% |
| Immigrants | Northern Europe | 99.8 /100 | #60 | Exceptional 96.7% |
| Immigrants | Austria | 99.8 /100 | #61 | Exceptional 96.7% |
| Whites/Caucasians | 99.8 /100 | #62 | Exceptional 96.7% |
| Ukrainians | 99.7 /100 | #63 | Exceptional 96.7% |
| Immigrants | India | 99.7 /100 | #64 | Exceptional 96.6% |
| Native Hawaiians | 99.7 /100 | #65 | Exceptional 96.6% |
| Canadians | 99.7 /100 | #66 | Exceptional 96.6% |
| Iranians | 99.7 /100 | #67 | Exceptional 96.6% |
| Creek | 99.7 /100 | #68 | Exceptional 96.6% |
| Americans | 99.7 /100 | #69 | Exceptional 96.6% |
| Immigrants | Lithuania | 99.6 /100 | #70 | Exceptional 96.6% |
| New Zealanders | 99.5 /100 | #71 | Exceptional 96.6% |
| Immigrants | England | 99.5 /100 | #72 | Exceptional 96.6% |
| Arapaho | 99.5 /100 | #73 | Exceptional 96.6% |
Demographics Similar to Immigrants from Middle Africa by 8th Grade
In terms of 8th grade, the demographic groups most similar to Immigrants from Middle Africa are Tongan (95.1%, a difference of 0.0%), Paiute (95.1%, a difference of 0.0%), South American Indian (95.1%, a difference of 0.020%), Immigrants from Sierra Leone (95.1%, a difference of 0.030%), and Ethiopian (95.1%, a difference of 0.030%).
| Demographics | Rating | Rank | 8th Grade |
| Immigrants | Africa | 2.7 /100 | #237 | Tragic 95.2% |
| Natives/Alaskans | 2.3 /100 | #238 | Tragic 95.2% |
| Immigrants | Sierra Leone | 2.1 /100 | #239 | Tragic 95.1% |
| Ethiopians | 2.0 /100 | #240 | Tragic 95.1% |
| South American Indians | 1.9 /100 | #241 | Tragic 95.1% |
| Tongans | 1.7 /100 | #242 | Tragic 95.1% |
| Paiute | 1.7 /100 | #243 | Tragic 95.1% |
| Immigrants | Middle Africa | 1.7 /100 | #244 | Tragic 95.1% |
| Jamaicans | 1.4 /100 | #245 | Tragic 95.1% |
| Somalis | 1.4 /100 | #246 | Tragic 95.1% |
| Immigrants | Senegal | 1.4 /100 | #247 | Tragic 95.1% |
| Uruguayans | 1.2 /100 | #248 | Tragic 95.1% |
| Immigrants | China | 1.1 /100 | #249 | Tragic 95.0% |
| Koreans | 1.1 /100 | #250 | Tragic 95.0% |
| Bolivians | 1.0 /100 | #251 | Tragic 95.0% |