Cambodian vs Finnish Single Mother Households
COMPARE
Cambodian
Finnish
Single Mother Households
Single Mother Households Comparison
Cambodians
Finns
5.3%
SINGLE MOTHER HOUSEHOLDS
99.7/ 100
METRIC RATING
32nd/ 347
METRIC RANK
5.7%
SINGLE MOTHER HOUSEHOLDS
97.6/ 100
METRIC RATING
86th/ 347
METRIC RANK
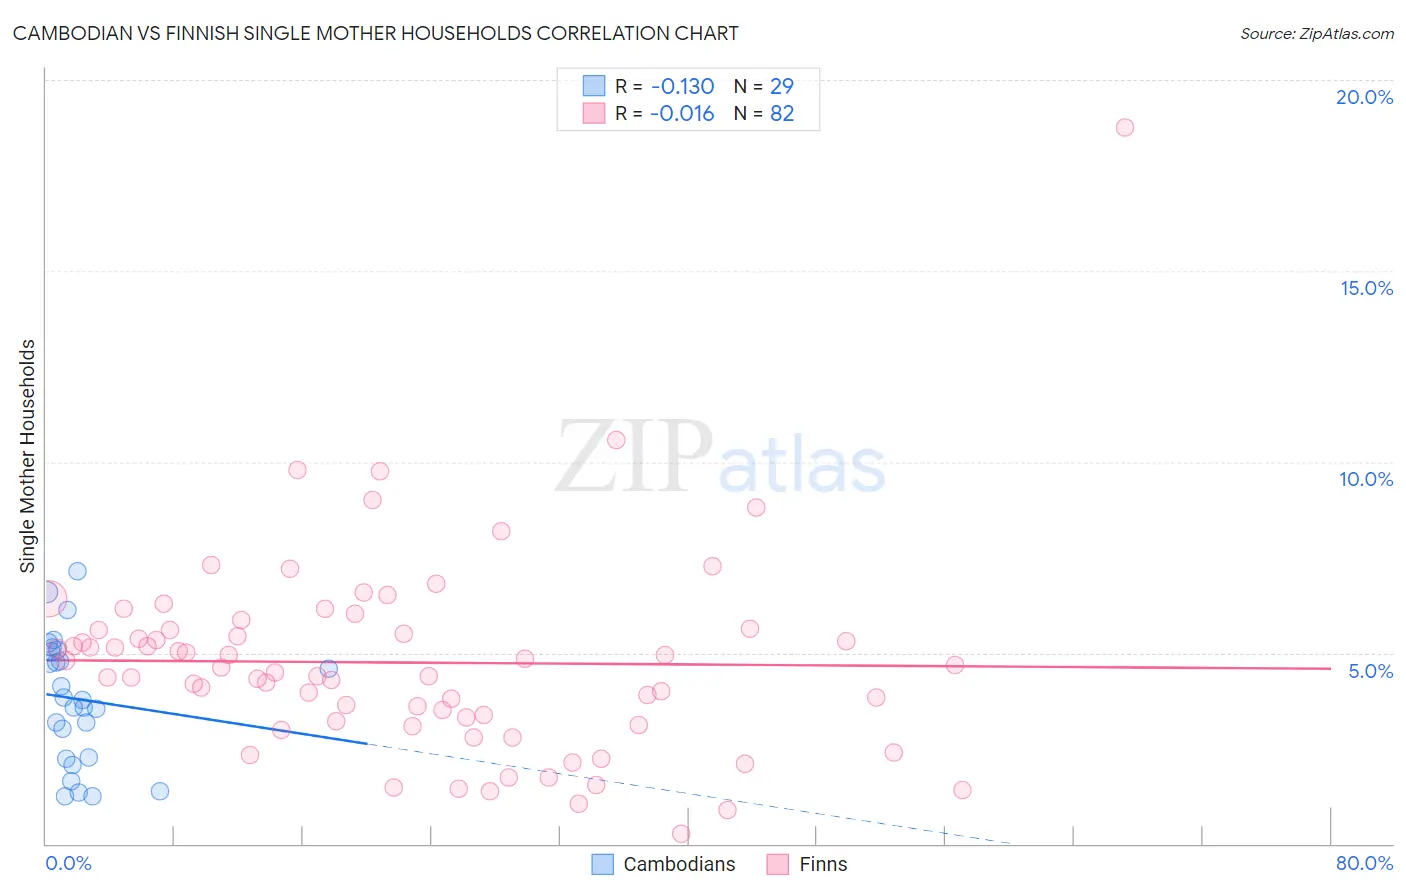
Cambodian vs Finnish Single Mother Households Correlation Chart
The statistical analysis conducted on geographies consisting of 102,433,936 people shows a poor negative correlation between the proportion of Cambodians and percentage of single mother households in the United States with a correlation coefficient (R) of -0.130 and weighted average of 5.3%. Similarly, the statistical analysis conducted on geographies consisting of 403,107,301 people shows no correlation between the proportion of Finns and percentage of single mother households in the United States with a correlation coefficient (R) of -0.016 and weighted average of 5.7%, a difference of 7.3%.
Single Mother Households Correlation Summary
| Measurement | Cambodian | Finnish |
| Minimum | 1.2% | 0.26% |
| Maximum | 7.1% | 18.8% |
| Range | 5.9% | 18.5% |
| Mean | 3.8% | 4.7% |
| Median | 3.8% | 4.5% |
| Interquartile 25% (IQ1) | 2.2% | 3.2% |
| Interquartile 75% (IQ3) | 5.1% | 5.6% |
| Interquartile Range (IQR) | 2.8% | 2.4% |
| Standard Deviation (Sample) | 1.6% | 2.6% |
| Standard Deviation (Population) | 1.6% | 2.6% |
Similar Demographics by Single Mother Households
Demographics Similar to Cambodians by Single Mother Households
In terms of single mother households, the demographic groups most similar to Cambodians are Burmese (5.3%, a difference of 0.010%), Immigrants from Korea (5.3%, a difference of 0.010%), Latvian (5.3%, a difference of 0.070%), Russian (5.3%, a difference of 0.090%), and Bhutanese (5.3%, a difference of 0.19%).
| Demographics | Rating | Rank | Single Mother Households |
| Immigrants | Japan | 99.8 /100 | #25 | Exceptional 5.2% |
| Immigrants | Lithuania | 99.8 /100 | #26 | Exceptional 5.3% |
| Bhutanese | 99.7 /100 | #27 | Exceptional 5.3% |
| Russians | 99.7 /100 | #28 | Exceptional 5.3% |
| Latvians | 99.7 /100 | #29 | Exceptional 5.3% |
| Burmese | 99.7 /100 | #30 | Exceptional 5.3% |
| Immigrants | Korea | 99.7 /100 | #31 | Exceptional 5.3% |
| Cambodians | 99.7 /100 | #32 | Exceptional 5.3% |
| Immigrants | Switzerland | 99.7 /100 | #33 | Exceptional 5.3% |
| Bulgarians | 99.7 /100 | #34 | Exceptional 5.3% |
| Immigrants | Northern Europe | 99.7 /100 | #35 | Exceptional 5.3% |
| Immigrants | Czechoslovakia | 99.7 /100 | #36 | Exceptional 5.3% |
| Immigrants | Belgium | 99.7 /100 | #37 | Exceptional 5.3% |
| Immigrants | Serbia | 99.6 /100 | #38 | Exceptional 5.4% |
| Immigrants | Sweden | 99.6 /100 | #39 | Exceptional 5.4% |
Demographics Similar to Finns by Single Mother Households
In terms of single mother households, the demographic groups most similar to Finns are Hungarian (5.7%, a difference of 0.030%), Immigrants from Turkey (5.7%, a difference of 0.080%), Israeli (5.7%, a difference of 0.15%), Carpatho Rusyn (5.7%, a difference of 0.18%), and Immigrants from Hungary (5.7%, a difference of 0.25%).
| Demographics | Rating | Rank | Single Mother Households |
| Immigrants | Sri Lanka | 98.0 /100 | #79 | Exceptional 5.6% |
| Czechs | 97.9 /100 | #80 | Exceptional 5.6% |
| Immigrants | Moldova | 97.9 /100 | #81 | Exceptional 5.6% |
| Immigrants | Malaysia | 97.8 /100 | #82 | Exceptional 5.7% |
| Immigrants | Hungary | 97.8 /100 | #83 | Exceptional 5.7% |
| Carpatho Rusyns | 97.7 /100 | #84 | Exceptional 5.7% |
| Hungarians | 97.6 /100 | #85 | Exceptional 5.7% |
| Finns | 97.6 /100 | #86 | Exceptional 5.7% |
| Immigrants | Turkey | 97.5 /100 | #87 | Exceptional 5.7% |
| Israelis | 97.4 /100 | #88 | Exceptional 5.7% |
| Ukrainians | 97.2 /100 | #89 | Exceptional 5.7% |
| Immigrants | Indonesia | 97.2 /100 | #90 | Exceptional 5.7% |
| Europeans | 97.0 /100 | #91 | Exceptional 5.7% |
| Immigrants | Western Asia | 96.7 /100 | #92 | Exceptional 5.7% |
| Serbians | 96.7 /100 | #93 | Exceptional 5.7% |