Cambodian vs Egyptian Single Mother Households
COMPARE
Cambodian
Egyptian
Single Mother Households
Single Mother Households Comparison
Cambodians
Egyptians
5.3%
SINGLE MOTHER HOUSEHOLDS
99.7/ 100
METRIC RATING
32nd/ 347
METRIC RANK
5.9%
SINGLE MOTHER HOUSEHOLDS
90.7/ 100
METRIC RATING
133rd/ 347
METRIC RANK
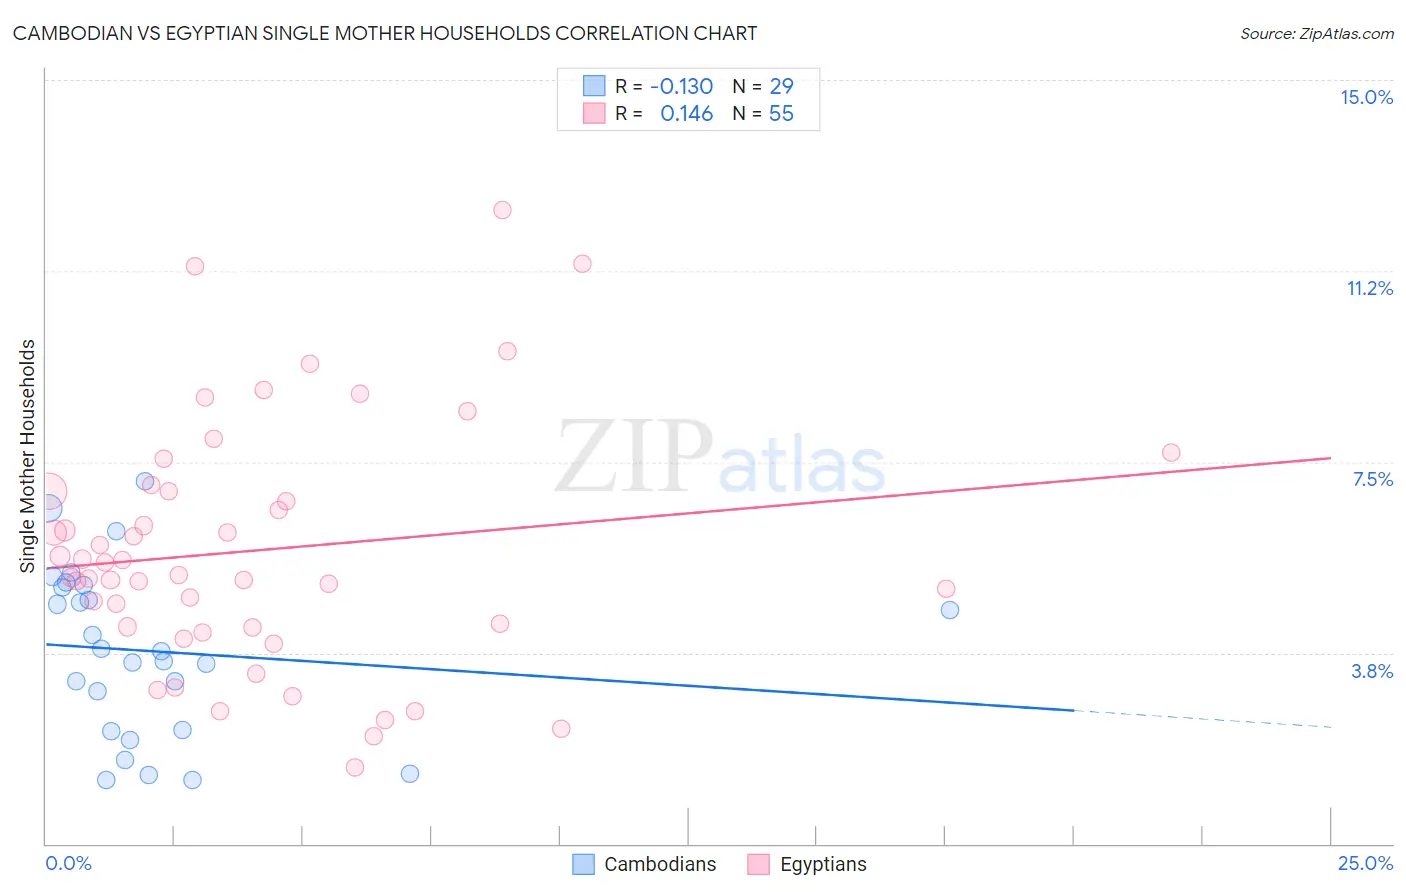
Cambodian vs Egyptian Single Mother Households Correlation Chart
The statistical analysis conducted on geographies consisting of 102,433,936 people shows a poor negative correlation between the proportion of Cambodians and percentage of single mother households in the United States with a correlation coefficient (R) of -0.130 and weighted average of 5.3%. Similarly, the statistical analysis conducted on geographies consisting of 276,342,561 people shows a poor positive correlation between the proportion of Egyptians and percentage of single mother households in the United States with a correlation coefficient (R) of 0.146 and weighted average of 5.9%, a difference of 11.9%.
Single Mother Households Correlation Summary
| Measurement | Cambodian | Egyptian |
| Minimum | 1.2% | 1.5% |
| Maximum | 7.1% | 12.4% |
| Range | 5.9% | 11.0% |
| Mean | 3.8% | 5.8% |
| Median | 3.8% | 5.3% |
| Interquartile 25% (IQ1) | 2.2% | 4.2% |
| Interquartile 75% (IQ3) | 5.1% | 6.9% |
| Interquartile Range (IQR) | 2.8% | 2.7% |
| Standard Deviation (Sample) | 1.6% | 2.4% |
| Standard Deviation (Population) | 1.6% | 2.4% |
Similar Demographics by Single Mother Households
Demographics Similar to Cambodians by Single Mother Households
In terms of single mother households, the demographic groups most similar to Cambodians are Burmese (5.3%, a difference of 0.010%), Immigrants from Korea (5.3%, a difference of 0.010%), Latvian (5.3%, a difference of 0.070%), Russian (5.3%, a difference of 0.090%), and Bhutanese (5.3%, a difference of 0.19%).
| Demographics | Rating | Rank | Single Mother Households |
| Immigrants | Japan | 99.8 /100 | #25 | Exceptional 5.2% |
| Immigrants | Lithuania | 99.8 /100 | #26 | Exceptional 5.3% |
| Bhutanese | 99.7 /100 | #27 | Exceptional 5.3% |
| Russians | 99.7 /100 | #28 | Exceptional 5.3% |
| Latvians | 99.7 /100 | #29 | Exceptional 5.3% |
| Burmese | 99.7 /100 | #30 | Exceptional 5.3% |
| Immigrants | Korea | 99.7 /100 | #31 | Exceptional 5.3% |
| Cambodians | 99.7 /100 | #32 | Exceptional 5.3% |
| Immigrants | Switzerland | 99.7 /100 | #33 | Exceptional 5.3% |
| Bulgarians | 99.7 /100 | #34 | Exceptional 5.3% |
| Immigrants | Northern Europe | 99.7 /100 | #35 | Exceptional 5.3% |
| Immigrants | Czechoslovakia | 99.7 /100 | #36 | Exceptional 5.3% |
| Immigrants | Belgium | 99.7 /100 | #37 | Exceptional 5.3% |
| Immigrants | Serbia | 99.6 /100 | #38 | Exceptional 5.4% |
| Immigrants | Sweden | 99.6 /100 | #39 | Exceptional 5.4% |
Demographics Similar to Egyptians by Single Mother Households
In terms of single mother households, the demographic groups most similar to Egyptians are Canadian (5.9%, a difference of 0.060%), Albanian (5.9%, a difference of 0.15%), Immigrants from Saudi Arabia (5.9%, a difference of 0.15%), Immigrants from Spain (5.9%, a difference of 0.20%), and Palestinian (5.9%, a difference of 0.55%).
| Demographics | Rating | Rank | Single Mother Households |
| Welsh | 92.8 /100 | #126 | Exceptional 5.9% |
| Lebanese | 92.4 /100 | #127 | Exceptional 5.9% |
| Czechoslovakians | 92.2 /100 | #128 | Exceptional 5.9% |
| Immigrants | Bolivia | 92.2 /100 | #129 | Exceptional 5.9% |
| Palestinians | 92.1 /100 | #130 | Exceptional 5.9% |
| Immigrants | Spain | 91.2 /100 | #131 | Exceptional 5.9% |
| Albanians | 91.1 /100 | #132 | Exceptional 5.9% |
| Egyptians | 90.7 /100 | #133 | Exceptional 5.9% |
| Canadians | 90.5 /100 | #134 | Exceptional 5.9% |
| Immigrants | Saudi Arabia | 90.2 /100 | #135 | Exceptional 5.9% |
| Jordanians | 88.9 /100 | #136 | Excellent 6.0% |
| Immigrants | Pakistan | 88.4 /100 | #137 | Excellent 6.0% |
| Icelanders | 86.9 /100 | #138 | Excellent 6.0% |
| Syrians | 86.0 /100 | #139 | Excellent 6.0% |
| French | 85.7 /100 | #140 | Excellent 6.0% |