Cambodian vs Immigrants from Oceania Single Mother Households
COMPARE
Cambodian
Immigrants from Oceania
Single Mother Households
Single Mother Households Comparison
Cambodians
Immigrants from Oceania
5.3%
SINGLE MOTHER HOUSEHOLDS
99.7/ 100
METRIC RATING
32nd/ 347
METRIC RANK
6.3%
SINGLE MOTHER HOUSEHOLDS
54.6/ 100
METRIC RATING
170th/ 347
METRIC RANK
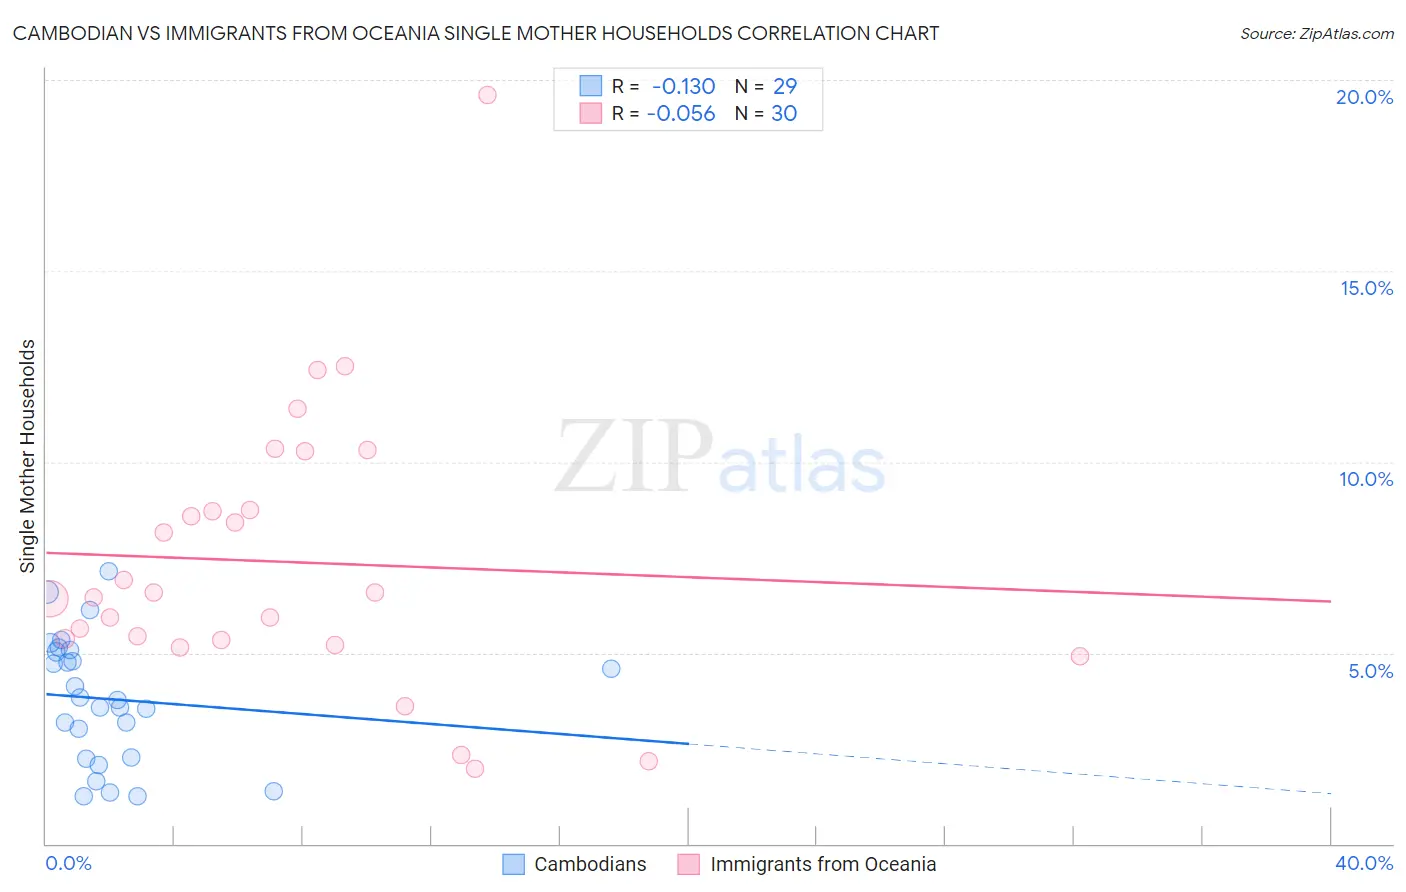
Cambodian vs Immigrants from Oceania Single Mother Households Correlation Chart
The statistical analysis conducted on geographies consisting of 102,433,936 people shows a poor negative correlation between the proportion of Cambodians and percentage of single mother households in the United States with a correlation coefficient (R) of -0.130 and weighted average of 5.3%. Similarly, the statistical analysis conducted on geographies consisting of 304,825,048 people shows a slight negative correlation between the proportion of Immigrants from Oceania and percentage of single mother households in the United States with a correlation coefficient (R) of -0.056 and weighted average of 6.3%, a difference of 18.7%.
Single Mother Households Correlation Summary
| Measurement | Cambodian | Immigrants from Oceania |
| Minimum | 1.2% | 2.0% |
| Maximum | 7.1% | 19.6% |
| Range | 5.9% | 17.6% |
| Mean | 3.8% | 7.4% |
| Median | 3.8% | 6.5% |
| Interquartile 25% (IQ1) | 2.2% | 5.3% |
| Interquartile 75% (IQ3) | 5.1% | 8.7% |
| Interquartile Range (IQR) | 2.8% | 3.4% |
| Standard Deviation (Sample) | 1.6% | 3.6% |
| Standard Deviation (Population) | 1.6% | 3.6% |
Similar Demographics by Single Mother Households
Demographics Similar to Cambodians by Single Mother Households
In terms of single mother households, the demographic groups most similar to Cambodians are Burmese (5.3%, a difference of 0.010%), Immigrants from Korea (5.3%, a difference of 0.010%), Latvian (5.3%, a difference of 0.070%), Russian (5.3%, a difference of 0.090%), and Bhutanese (5.3%, a difference of 0.19%).
| Demographics | Rating | Rank | Single Mother Households |
| Immigrants | Japan | 99.8 /100 | #25 | Exceptional 5.2% |
| Immigrants | Lithuania | 99.8 /100 | #26 | Exceptional 5.3% |
| Bhutanese | 99.7 /100 | #27 | Exceptional 5.3% |
| Russians | 99.7 /100 | #28 | Exceptional 5.3% |
| Latvians | 99.7 /100 | #29 | Exceptional 5.3% |
| Burmese | 99.7 /100 | #30 | Exceptional 5.3% |
| Immigrants | Korea | 99.7 /100 | #31 | Exceptional 5.3% |
| Cambodians | 99.7 /100 | #32 | Exceptional 5.3% |
| Immigrants | Switzerland | 99.7 /100 | #33 | Exceptional 5.3% |
| Bulgarians | 99.7 /100 | #34 | Exceptional 5.3% |
| Immigrants | Northern Europe | 99.7 /100 | #35 | Exceptional 5.3% |
| Immigrants | Czechoslovakia | 99.7 /100 | #36 | Exceptional 5.3% |
| Immigrants | Belgium | 99.7 /100 | #37 | Exceptional 5.3% |
| Immigrants | Serbia | 99.6 /100 | #38 | Exceptional 5.4% |
| Immigrants | Sweden | 99.6 /100 | #39 | Exceptional 5.4% |
Demographics Similar to Immigrants from Oceania by Single Mother Households
In terms of single mother households, the demographic groups most similar to Immigrants from Oceania are Afghan (6.3%, a difference of 0.23%), Immigrants from South Eastern Asia (6.3%, a difference of 0.26%), Immigrants from Vietnam (6.3%, a difference of 0.34%), Puget Sound Salish (6.3%, a difference of 0.40%), and Immigrants from Chile (6.3%, a difference of 0.42%).
| Demographics | Rating | Rank | Single Mother Households |
| Alsatians | 68.7 /100 | #163 | Good 6.2% |
| Immigrants | Northern Africa | 68.0 /100 | #164 | Good 6.2% |
| Immigrants | Syria | 67.4 /100 | #165 | Good 6.2% |
| Sri Lankans | 63.9 /100 | #166 | Good 6.2% |
| Brazilians | 59.1 /100 | #167 | Average 6.2% |
| Immigrants | Chile | 58.3 /100 | #168 | Average 6.3% |
| Puget Sound Salish | 58.1 /100 | #169 | Average 6.3% |
| Immigrants | Oceania | 54.6 /100 | #170 | Average 6.3% |
| Afghans | 52.5 /100 | #171 | Average 6.3% |
| Immigrants | South Eastern Asia | 52.2 /100 | #172 | Average 6.3% |
| Immigrants | Vietnam | 51.5 /100 | #173 | Average 6.3% |
| Immigrants | Morocco | 50.0 /100 | #174 | Average 6.3% |
| Marshallese | 45.8 /100 | #175 | Average 6.3% |
| Immigrants | Bosnia and Herzegovina | 44.3 /100 | #176 | Average 6.3% |
| Osage | 43.0 /100 | #177 | Average 6.4% |