Cambodian vs Cuban Male Disability
COMPARE
Cambodian
Cuban
Male Disability
Male Disability Comparison
Cambodians
Cubans
10.3%
MALE DISABILITY
99.7/ 100
METRIC RATING
46th/ 347
METRIC RANK
11.0%
MALE DISABILITY
74.9/ 100
METRIC RATING
151st/ 347
METRIC RANK
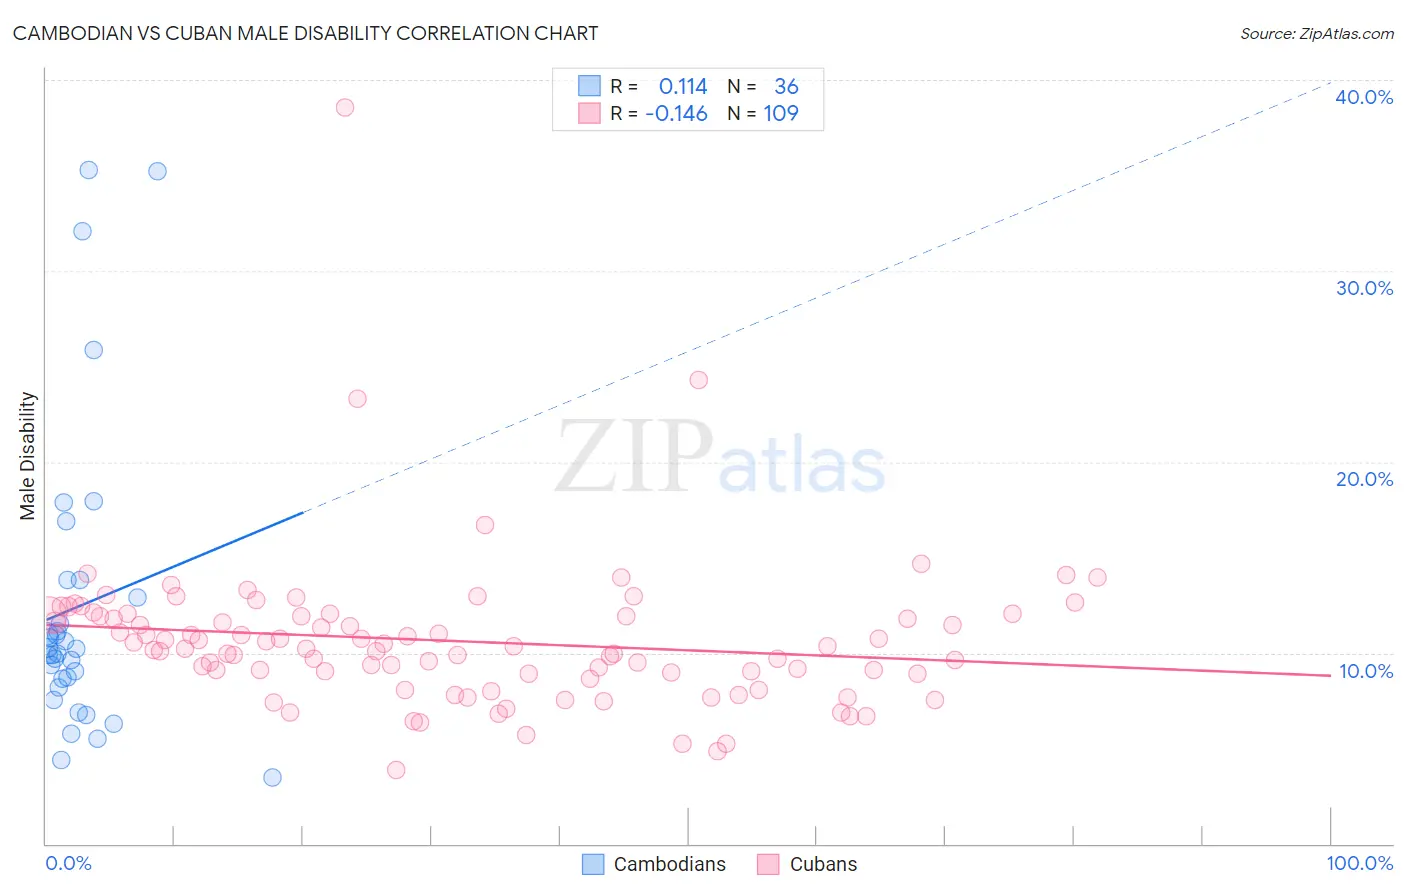
Cambodian vs Cuban Male Disability Correlation Chart
The statistical analysis conducted on geographies consisting of 102,516,296 people shows a poor positive correlation between the proportion of Cambodians and percentage of males with a disability in the United States with a correlation coefficient (R) of 0.114 and weighted average of 10.3%. Similarly, the statistical analysis conducted on geographies consisting of 449,227,297 people shows a poor negative correlation between the proportion of Cubans and percentage of males with a disability in the United States with a correlation coefficient (R) of -0.146 and weighted average of 11.0%, a difference of 7.1%.
Male Disability Correlation Summary
| Measurement | Cambodian | Cuban |
| Minimum | 3.5% | 3.9% |
| Maximum | 35.3% | 38.6% |
| Range | 31.8% | 34.7% |
| Mean | 12.4% | 10.6% |
| Median | 10.1% | 10.2% |
| Interquartile 25% (IQ1) | 8.4% | 8.9% |
| Interquartile 75% (IQ3) | 13.4% | 11.9% |
| Interquartile Range (IQR) | 4.9% | 3.0% |
| Standard Deviation (Sample) | 7.9% | 4.0% |
| Standard Deviation (Population) | 7.8% | 4.0% |
Similar Demographics by Male Disability
Demographics Similar to Cambodians by Male Disability
In terms of male disability, the demographic groups most similar to Cambodians are Immigrants from Peru (10.3%, a difference of 0.040%), Israeli (10.3%, a difference of 0.070%), Turkish (10.3%, a difference of 0.080%), Immigrants from El Salvador (10.3%, a difference of 0.090%), and Immigrants from Spain (10.3%, a difference of 0.13%).
| Demographics | Rating | Rank | Male Disability |
| Afghans | 99.8 /100 | #39 | Exceptional 10.2% |
| Immigrants | Nepal | 99.8 /100 | #40 | Exceptional 10.3% |
| Taiwanese | 99.8 /100 | #41 | Exceptional 10.3% |
| Mongolians | 99.7 /100 | #42 | Exceptional 10.3% |
| Immigrants | Bangladesh | 99.7 /100 | #43 | Exceptional 10.3% |
| Immigrants | El Salvador | 99.7 /100 | #44 | Exceptional 10.3% |
| Turks | 99.7 /100 | #45 | Exceptional 10.3% |
| Cambodians | 99.7 /100 | #46 | Exceptional 10.3% |
| Immigrants | Peru | 99.7 /100 | #47 | Exceptional 10.3% |
| Israelis | 99.7 /100 | #48 | Exceptional 10.3% |
| Immigrants | Spain | 99.7 /100 | #49 | Exceptional 10.3% |
| South Americans | 99.6 /100 | #50 | Exceptional 10.3% |
| Salvadorans | 99.6 /100 | #51 | Exceptional 10.4% |
| Immigrants | Saudi Arabia | 99.6 /100 | #52 | Exceptional 10.4% |
| Immigrants | Uzbekistan | 99.6 /100 | #53 | Exceptional 10.4% |
Demographics Similar to Cubans by Male Disability
In terms of male disability, the demographic groups most similar to Cubans are Immigrants from Guatemala (11.0%, a difference of 0.020%), Immigrants from Albania (11.0%, a difference of 0.030%), Immigrants from Denmark (11.0%, a difference of 0.12%), Immigrants from Northern Europe (11.1%, a difference of 0.12%), and Immigrants from Moldova (11.1%, a difference of 0.15%).
| Demographics | Rating | Rank | Male Disability |
| Kenyans | 78.1 /100 | #144 | Good 11.0% |
| Costa Ricans | 78.0 /100 | #145 | Good 11.0% |
| Koreans | 77.5 /100 | #146 | Good 11.0% |
| Immigrants | Croatia | 77.3 /100 | #147 | Good 11.0% |
| Sudanese | 77.1 /100 | #148 | Good 11.0% |
| Immigrants | Denmark | 76.4 /100 | #149 | Good 11.0% |
| Immigrants | Guatemala | 75.1 /100 | #150 | Good 11.0% |
| Cubans | 74.9 /100 | #151 | Good 11.0% |
| Immigrants | Albania | 74.4 /100 | #152 | Good 11.0% |
| Immigrants | Northern Europe | 73.2 /100 | #153 | Good 11.1% |
| Immigrants | Moldova | 72.8 /100 | #154 | Good 11.1% |
| Immigrants | Middle Africa | 70.9 /100 | #155 | Good 11.1% |
| Russians | 69.8 /100 | #156 | Good 11.1% |
| Immigrants | Western Africa | 69.2 /100 | #157 | Good 11.1% |
| Latvians | 68.1 /100 | #158 | Good 11.1% |