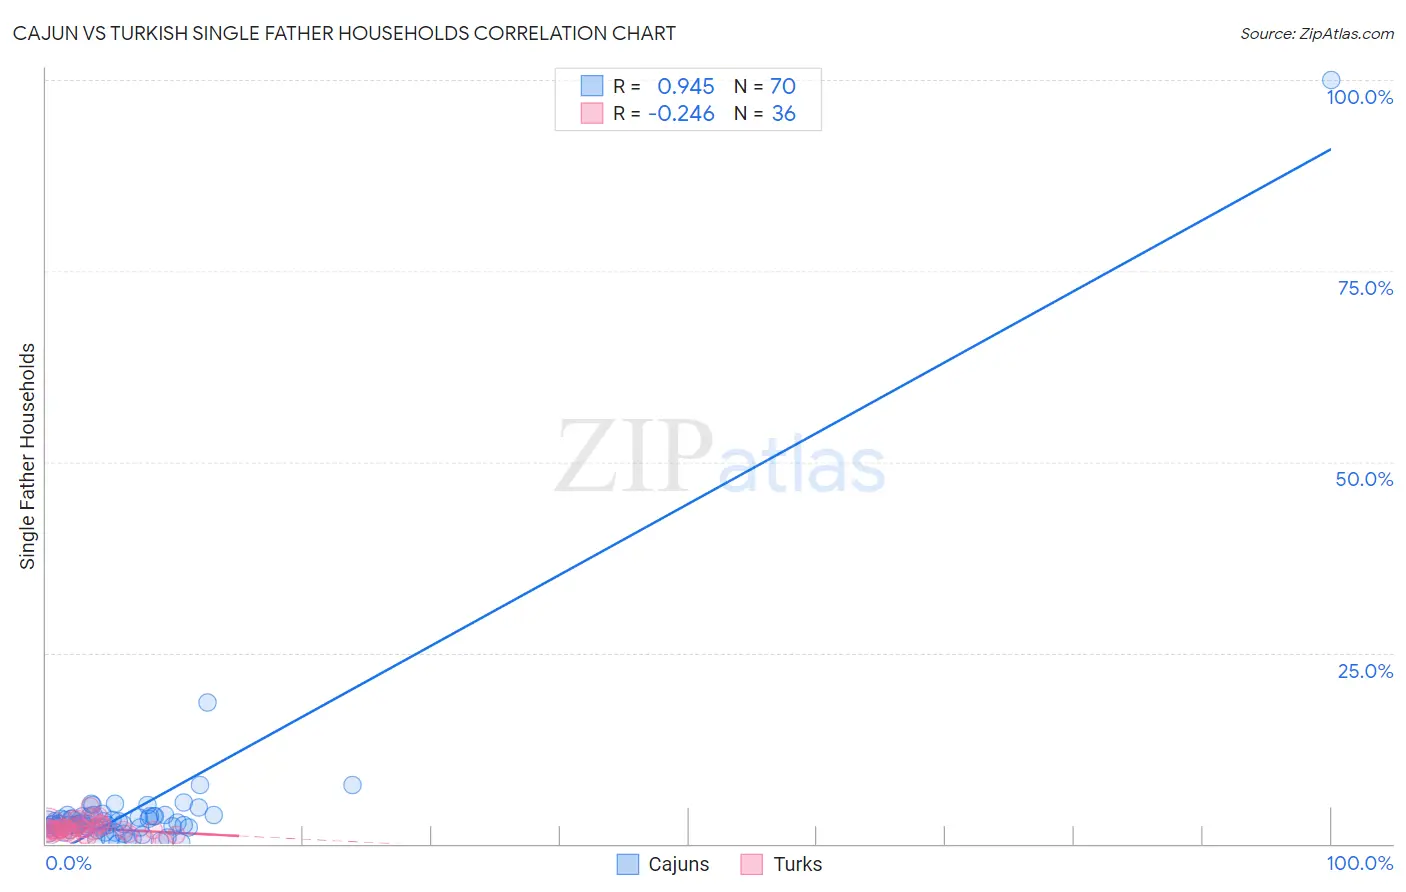
Cajun vs Turkish Single Father Households
COMPARE
Cajun
Turkish
Single Father Households
Single Father Households Comparison
Cajuns
Turks
2.5%
SINGLE FATHER HOUSEHOLDS
6.1/ 100
METRIC RATING
236th/ 347
METRIC RANK
2.0%
SINGLE FATHER HOUSEHOLDS
100.0/ 100
METRIC RATING
33rd/ 347
METRIC RANK
Cajun vs Turkish Single Father Households Correlation Chart
The statistical analysis conducted on geographies consisting of 148,931,799 people shows a near-perfect positive correlation between the proportion of Cajuns and percentage of single father households in the United States with a correlation coefficient (R) of 0.945 and weighted average of 2.5%. Similarly, the statistical analysis conducted on geographies consisting of 270,298,276 people shows a weak negative correlation between the proportion of Turks and percentage of single father households in the United States with a correlation coefficient (R) of -0.246 and weighted average of 2.0%, a difference of 24.2%.
Single Father Households Correlation Summary
| Measurement | Cajun | Turkish |
| Minimum | 0.066% | 0.37% |
| Maximum | 100.0% | 5.0% |
| Range | 99.9% | 4.6% |
| Mean | 4.4% | 2.0% |
| Median | 2.6% | 1.9% |
| Interquartile 25% (IQ1) | 2.1% | 1.6% |
| Interquartile 75% (IQ3) | 3.6% | 2.3% |
| Interquartile Range (IQR) | 1.5% | 0.70% |
| Standard Deviation (Sample) | 11.8% | 0.89% |
| Standard Deviation (Population) | 11.8% | 0.88% |
Similar Demographics by Single Father Households
Demographics Similar to Cajuns by Single Father Households
In terms of single father households, the demographic groups most similar to Cajuns are Immigrants (2.5%, a difference of 0.050%), Sierra Leonean (2.5%, a difference of 0.050%), African (2.5%, a difference of 0.070%), Immigrants from Sierra Leone (2.5%, a difference of 0.080%), and Immigrants from Oceania (2.5%, a difference of 0.090%).
| Demographics | Rating | Rank | Single Father Households |
| Immigrants | Zaire | 8.6 /100 | #229 | Tragic 2.4% |
| Sub-Saharan Africans | 8.3 /100 | #230 | Tragic 2.4% |
| Immigrants | Nonimmigrants | 7.6 /100 | #231 | Tragic 2.4% |
| Pennsylvania Germans | 7.3 /100 | #232 | Tragic 2.4% |
| Immigrants | Western Africa | 7.0 /100 | #233 | Tragic 2.4% |
| Africans | 6.3 /100 | #234 | Tragic 2.5% |
| Immigrants | Immigrants | 6.3 /100 | #235 | Tragic 2.5% |
| Cajuns | 6.1 /100 | #236 | Tragic 2.5% |
| Sierra Leoneans | 5.9 /100 | #237 | Tragic 2.5% |
| Immigrants | Sierra Leone | 5.8 /100 | #238 | Tragic 2.5% |
| Immigrants | Oceania | 5.8 /100 | #239 | Tragic 2.5% |
| Immigrants | Dominica | 4.8 /100 | #240 | Tragic 2.5% |
| Portuguese | 4.1 /100 | #241 | Tragic 2.5% |
| Osage | 4.1 /100 | #242 | Tragic 2.5% |
| Spaniards | 3.1 /100 | #243 | Tragic 2.5% |
Demographics Similar to Turks by Single Father Households
In terms of single father households, the demographic groups most similar to Turks are Immigrants from Australia (2.0%, a difference of 0.020%), Chinese (2.0%, a difference of 0.21%), Israeli (2.0%, a difference of 0.25%), Cambodian (2.0%, a difference of 0.28%), and Bulgarian (2.0%, a difference of 0.31%).
| Demographics | Rating | Rank | Single Father Households |
| Assyrians/Chaldeans/Syriacs | 100.0 /100 | #26 | Exceptional 2.0% |
| Immigrants | South Central Asia | 100.0 /100 | #27 | Exceptional 2.0% |
| Immigrants | Japan | 100.0 /100 | #28 | Exceptional 2.0% |
| Bulgarians | 100.0 /100 | #29 | Exceptional 2.0% |
| Cambodians | 100.0 /100 | #30 | Exceptional 2.0% |
| Israelis | 100.0 /100 | #31 | Exceptional 2.0% |
| Chinese | 100.0 /100 | #32 | Exceptional 2.0% |
| Turks | 100.0 /100 | #33 | Exceptional 2.0% |
| Immigrants | Australia | 100.0 /100 | #34 | Exceptional 2.0% |
| Albanians | 100.0 /100 | #35 | Exceptional 2.0% |
| Immigrants | Belgium | 100.0 /100 | #36 | Exceptional 2.0% |
| Immigrants | St. Vincent and the Grenadines | 100.0 /100 | #37 | Exceptional 2.0% |
| Immigrants | Eastern Europe | 100.0 /100 | #38 | Exceptional 2.0% |
| Immigrants | Sri Lanka | 100.0 /100 | #39 | Exceptional 2.0% |
| Immigrants | Bulgaria | 100.0 /100 | #40 | Exceptional 2.0% |