Laotian vs Turkish Single Father Households
COMPARE
Laotian
Turkish
Single Father Households
Single Father Households Comparison
Laotians
Turks
2.2%
SINGLE FATHER HOUSEHOLDS
92.5/ 100
METRIC RATING
141st/ 347
METRIC RANK
2.0%
SINGLE FATHER HOUSEHOLDS
100.0/ 100
METRIC RATING
33rd/ 347
METRIC RANK
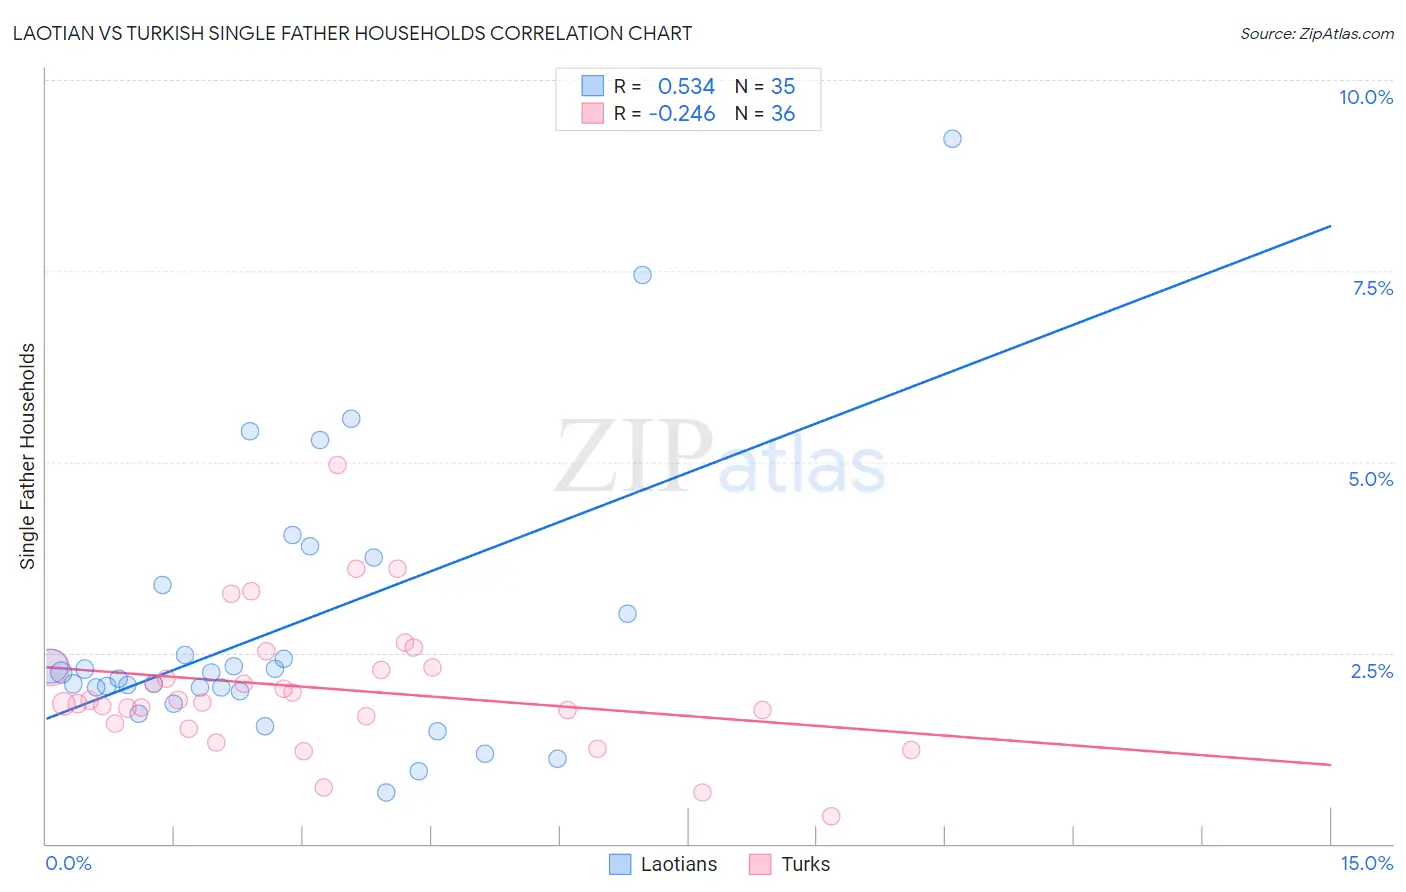
Laotian vs Turkish Single Father Households Correlation Chart
The statistical analysis conducted on geographies consisting of 223,877,457 people shows a substantial positive correlation between the proportion of Laotians and percentage of single father households in the United States with a correlation coefficient (R) of 0.534 and weighted average of 2.2%. Similarly, the statistical analysis conducted on geographies consisting of 270,298,276 people shows a weak negative correlation between the proportion of Turks and percentage of single father households in the United States with a correlation coefficient (R) of -0.246 and weighted average of 2.0%, a difference of 12.9%.
Single Father Households Correlation Summary
| Measurement | Laotian | Turkish |
| Minimum | 0.67% | 0.37% |
| Maximum | 9.2% | 5.0% |
| Range | 8.6% | 4.6% |
| Mean | 2.8% | 2.0% |
| Median | 2.2% | 1.9% |
| Interquartile 25% (IQ1) | 2.0% | 1.6% |
| Interquartile 75% (IQ3) | 3.4% | 2.3% |
| Interquartile Range (IQR) | 1.4% | 0.70% |
| Standard Deviation (Sample) | 1.8% | 0.89% |
| Standard Deviation (Population) | 1.8% | 0.88% |
Similar Demographics by Single Father Households
Demographics Similar to Laotians by Single Father Households
In terms of single father households, the demographic groups most similar to Laotians are Luxembourger (2.2%, a difference of 0.040%), Brazilian (2.2%, a difference of 0.090%), British (2.2%, a difference of 0.090%), Immigrants from Nepal (2.2%, a difference of 0.10%), and Slovak (2.2%, a difference of 0.44%).
| Demographics | Rating | Rank | Single Father Households |
| Zimbabweans | 95.1 /100 | #134 | Exceptional 2.2% |
| Syrians | 94.8 /100 | #135 | Exceptional 2.2% |
| Chileans | 94.5 /100 | #136 | Exceptional 2.2% |
| Austrians | 94.2 /100 | #137 | Exceptional 2.2% |
| West Indians | 94.1 /100 | #138 | Exceptional 2.2% |
| Brazilians | 92.8 /100 | #139 | Exceptional 2.2% |
| British | 92.8 /100 | #140 | Exceptional 2.2% |
| Laotians | 92.5 /100 | #141 | Exceptional 2.2% |
| Luxembourgers | 92.3 /100 | #142 | Exceptional 2.2% |
| Immigrants | Nepal | 92.1 /100 | #143 | Exceptional 2.2% |
| Slovaks | 90.7 /100 | #144 | Exceptional 2.2% |
| Immigrants | Zimbabwe | 90.2 /100 | #145 | Exceptional 2.2% |
| Northern Europeans | 89.8 /100 | #146 | Excellent 2.2% |
| Slavs | 88.9 /100 | #147 | Excellent 2.2% |
| South American Indians | 88.5 /100 | #148 | Excellent 2.3% |
Demographics Similar to Turks by Single Father Households
In terms of single father households, the demographic groups most similar to Turks are Immigrants from Australia (2.0%, a difference of 0.020%), Chinese (2.0%, a difference of 0.21%), Israeli (2.0%, a difference of 0.25%), Cambodian (2.0%, a difference of 0.28%), and Bulgarian (2.0%, a difference of 0.31%).
| Demographics | Rating | Rank | Single Father Households |
| Assyrians/Chaldeans/Syriacs | 100.0 /100 | #26 | Exceptional 2.0% |
| Immigrants | South Central Asia | 100.0 /100 | #27 | Exceptional 2.0% |
| Immigrants | Japan | 100.0 /100 | #28 | Exceptional 2.0% |
| Bulgarians | 100.0 /100 | #29 | Exceptional 2.0% |
| Cambodians | 100.0 /100 | #30 | Exceptional 2.0% |
| Israelis | 100.0 /100 | #31 | Exceptional 2.0% |
| Chinese | 100.0 /100 | #32 | Exceptional 2.0% |
| Turks | 100.0 /100 | #33 | Exceptional 2.0% |
| Immigrants | Australia | 100.0 /100 | #34 | Exceptional 2.0% |
| Albanians | 100.0 /100 | #35 | Exceptional 2.0% |
| Immigrants | Belgium | 100.0 /100 | #36 | Exceptional 2.0% |
| Immigrants | St. Vincent and the Grenadines | 100.0 /100 | #37 | Exceptional 2.0% |
| Immigrants | Eastern Europe | 100.0 /100 | #38 | Exceptional 2.0% |
| Immigrants | Sri Lanka | 100.0 /100 | #39 | Exceptional 2.0% |
| Immigrants | Bulgaria | 100.0 /100 | #40 | Exceptional 2.0% |