Cajun vs Bangladeshi Single Father Households
COMPARE
Cajun
Bangladeshi
Single Father Households
Single Father Households Comparison
Cajuns
Bangladeshis
2.5%
SINGLE FATHER HOUSEHOLDS
6.1/ 100
METRIC RATING
236th/ 347
METRIC RANK
3.1%
SINGLE FATHER HOUSEHOLDS
0.0/ 100
METRIC RATING
327th/ 347
METRIC RANK
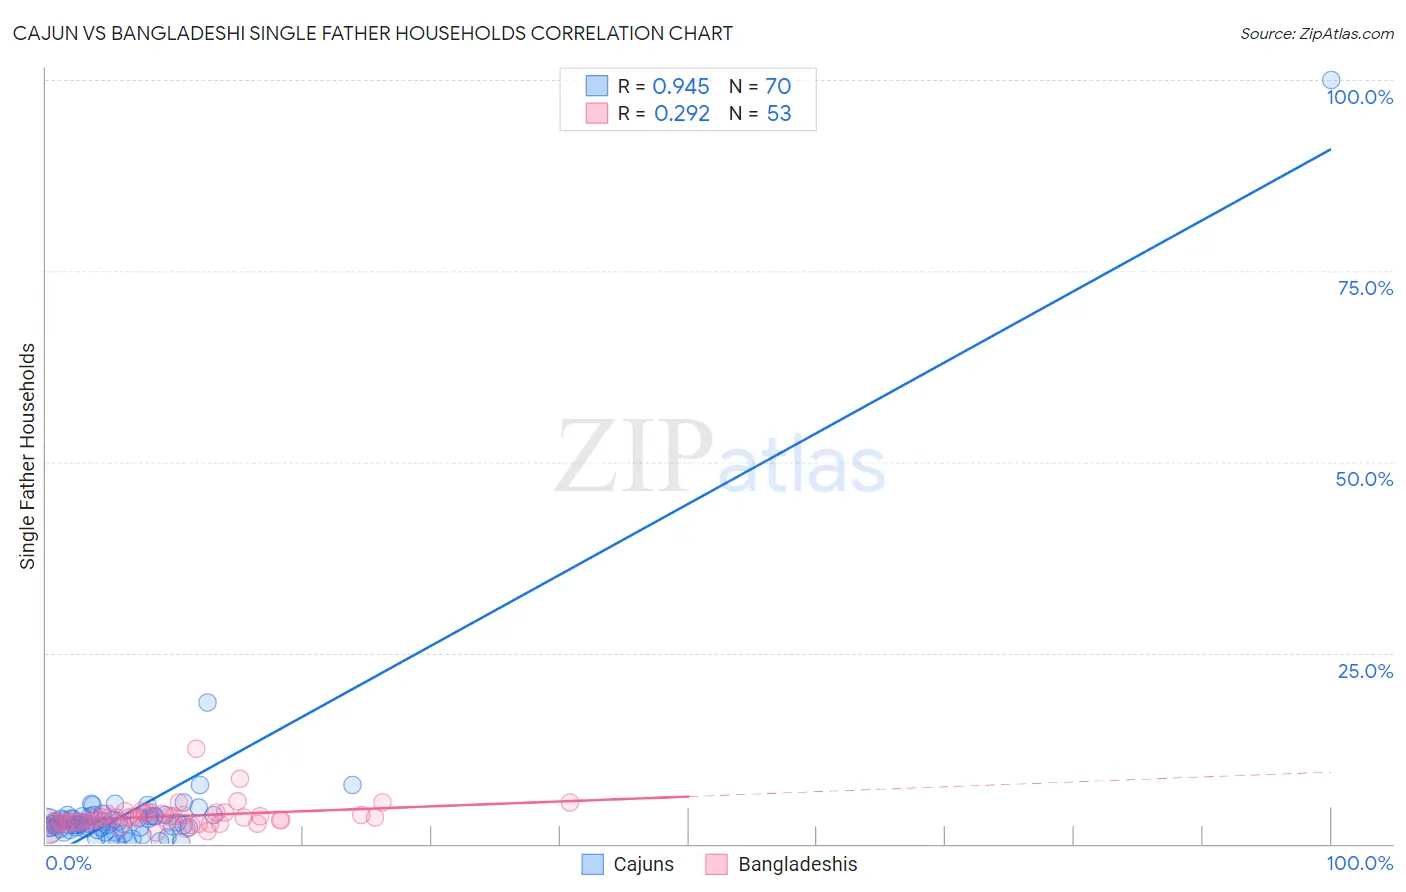
Cajun vs Bangladeshi Single Father Households Correlation Chart
The statistical analysis conducted on geographies consisting of 148,931,799 people shows a near-perfect positive correlation between the proportion of Cajuns and percentage of single father households in the United States with a correlation coefficient (R) of 0.945 and weighted average of 2.5%. Similarly, the statistical analysis conducted on geographies consisting of 140,991,030 people shows a weak positive correlation between the proportion of Bangladeshis and percentage of single father households in the United States with a correlation coefficient (R) of 0.292 and weighted average of 3.1%, a difference of 25.1%.
Single Father Households Correlation Summary
| Measurement | Cajun | Bangladeshi |
| Minimum | 0.066% | 1.4% |
| Maximum | 100.0% | 12.4% |
| Range | 99.9% | 11.0% |
| Mean | 4.4% | 3.6% |
| Median | 2.6% | 3.4% |
| Interquartile 25% (IQ1) | 2.1% | 2.7% |
| Interquartile 75% (IQ3) | 3.6% | 3.9% |
| Interquartile Range (IQR) | 1.5% | 1.2% |
| Standard Deviation (Sample) | 11.8% | 1.7% |
| Standard Deviation (Population) | 11.8% | 1.7% |
Similar Demographics by Single Father Households
Demographics Similar to Cajuns by Single Father Households
In terms of single father households, the demographic groups most similar to Cajuns are Immigrants (2.5%, a difference of 0.050%), Sierra Leonean (2.5%, a difference of 0.050%), African (2.5%, a difference of 0.070%), Immigrants from Sierra Leone (2.5%, a difference of 0.080%), and Immigrants from Oceania (2.5%, a difference of 0.090%).
| Demographics | Rating | Rank | Single Father Households |
| Immigrants | Zaire | 8.6 /100 | #229 | Tragic 2.4% |
| Sub-Saharan Africans | 8.3 /100 | #230 | Tragic 2.4% |
| Immigrants | Nonimmigrants | 7.6 /100 | #231 | Tragic 2.4% |
| Pennsylvania Germans | 7.3 /100 | #232 | Tragic 2.4% |
| Immigrants | Western Africa | 7.0 /100 | #233 | Tragic 2.4% |
| Africans | 6.3 /100 | #234 | Tragic 2.5% |
| Immigrants | Immigrants | 6.3 /100 | #235 | Tragic 2.5% |
| Cajuns | 6.1 /100 | #236 | Tragic 2.5% |
| Sierra Leoneans | 5.9 /100 | #237 | Tragic 2.5% |
| Immigrants | Sierra Leone | 5.8 /100 | #238 | Tragic 2.5% |
| Immigrants | Oceania | 5.8 /100 | #239 | Tragic 2.5% |
| Immigrants | Dominica | 4.8 /100 | #240 | Tragic 2.5% |
| Portuguese | 4.1 /100 | #241 | Tragic 2.5% |
| Osage | 4.1 /100 | #242 | Tragic 2.5% |
| Spaniards | 3.1 /100 | #243 | Tragic 2.5% |
Demographics Similar to Bangladeshis by Single Father Households
In terms of single father households, the demographic groups most similar to Bangladeshis are Immigrants from Cabo Verde (3.1%, a difference of 0.55%), Chippewa (3.1%, a difference of 0.65%), Aleut (3.0%, a difference of 0.88%), Immigrants from Mexico (3.0%, a difference of 1.1%), and Nepalese (3.1%, a difference of 1.5%).
| Demographics | Rating | Rank | Single Father Households |
| Guatemalans | 0.0 /100 | #320 | Tragic 3.0% |
| Mexicans | 0.0 /100 | #321 | Tragic 3.0% |
| Immigrants | Guatemala | 0.0 /100 | #322 | Tragic 3.0% |
| Immigrants | Central America | 0.0 /100 | #323 | Tragic 3.0% |
| Fijians | 0.0 /100 | #324 | Tragic 3.0% |
| Immigrants | Mexico | 0.0 /100 | #325 | Tragic 3.0% |
| Aleuts | 0.0 /100 | #326 | Tragic 3.0% |
| Bangladeshis | 0.0 /100 | #327 | Tragic 3.1% |
| Immigrants | Cabo Verde | 0.0 /100 | #328 | Tragic 3.1% |
| Chippewa | 0.0 /100 | #329 | Tragic 3.1% |
| Nepalese | 0.0 /100 | #330 | Tragic 3.1% |
| Navajo | 0.0 /100 | #331 | Tragic 3.2% |
| Yaqui | 0.0 /100 | #332 | Tragic 3.2% |
| Natives/Alaskans | 0.0 /100 | #333 | Tragic 3.2% |
| Yuman | 0.0 /100 | #334 | Tragic 3.3% |