Cajun vs Immigrants from Denmark Single Father Households

COMPARE

Cajun
Race
Ancestry
AfghanAfricanAlaska NativeAlaskan AthabascanAlbanianAleutAlsatianAmericanApacheArabArapahoArgentineanArmenianAssyrian/Chaldean/SyriacAustralianAustrianBahamianBangladeshiBarbadianBasqueBelgianBelizeanBermudanBhutaneseBlackfeetBolivianBrazilianBritishBritish West IndianBulgarianBurmeseCajunCambodianCanadianCape VerdeanCarpatho RusynCelticCentral AmericanCentral American IndianCherokeeCheyenneChickasawChileanChineseChippewaChoctawColombianColvilleComancheCosta RicanCreeCreekCroatianCrowCubanCypriotCzechCzechoslovakianDanishDelawareDominicanDutchDutch West IndianEastern EuropeanEcuadorianEgyptianEnglishEstonianEthiopianEuropeanFijianFilipinoFinnishFrenchFrench American IndianFrench CanadianGermanGerman RussianGhanaianGreekGuamanian/ChamorroGuatemalanGuyaneseHaitianHmongHonduranHopiHoumaHungarianIcelanderIndian (Asian)IndonesianInupiatIranianIraqiIrishIroquoisIsraeliItalianJamaicanJapaneseJordanianKenyanKiowaKoreanLaotianLatvianLebaneseLiberianLithuanianLumbeeLuxembourgerMacedonianMalaysianMalteseMarshalleseMenomineeMexicanMexican American IndianMongolianMoroccanNative HawaiianNavajoNepaleseNew ZealanderNicaraguanNigerianNorthern EuropeanNorwegianOkinawanOsageOttawaPaiutePakistaniPalestinianPanamanianParaguayanPennsylvania GermanPeruvianPimaPolishPortuguesePotawatomiPuebloPuerto RicanPuget Sound SalishRomanianRussianSalvadoranSamoanScandinavianScotch-IrishScottishSeminoleSenegaleseSerbianShoshoneSierra LeoneanSiouxSlavicSlovakSloveneSomaliSouth AfricanSouth AmericanSouth American IndianSoviet UnionSpaniardSpanishSpanish AmericanSpanish American IndianSri LankanSubsaharan AfricanSudaneseSwedishSwissSyrianTaiwaneseThaiTlingit-HaidaTohono O'OdhamTonganTrinidadian and TobagonianTsimshianTurkishU.S. Virgin IslanderUgandanUkrainianUruguayanUteVenezuelanVietnameseWelshWest IndianYakamaYaquiYugoslavianYumanYup'ikZimbabwean
Immigration
NonimmigrantsImmigrantsAfghanistanAfricaAlbaniaArgentinaArmeniaAsiaAustraliaAustriaBahamasBangladeshBarbadosBelarusBelgiumBelizeBoliviaBosnia and HerzegovinaBrazilBulgariaBurma/MyanmarCabo VerdeCambodiaCameroonCanadaCaribbeanCentral AmericaChileChinaColombiaCongoCosta RicaCroatiaCubaCzechoslovakiaDominicaDominican RepublicEastern AfricaEastern AsiaEastern EuropeEcuadorEgyptEl SalvadorEnglandEritreaEthiopiaEuropeFijiFranceGermanyGhanaGreeceGrenadaGuatemalaGuyanaHaitiHondurasHong KongHungaryIndiaIndonesiaIranIraqIrelandIsraelItalyJamaicaJapanJordanKazakhstanKenyaKoreaKuwaitLaosLatin AmericaLatviaLebanonLiberiaLithuaniaMalaysiaMexicoMicronesiaMiddle AfricaMoldovaMoroccoNepalNetherlandsNicaraguaNigeriaNorth AmericaNorth MacedoniaNorthern AfricaNorthern EuropeNorwayOceaniaPakistanPanamaPeruPhilippinesPolandPortugalRomaniaRussiaSaudi ArabiaScotlandSenegalSerbiaSierra LeoneSingaporeSomaliaSouth AfricaSouth AmericaSouth Central AsiaSouth Eastern AsiaSouthern EuropeSpainSri LankaSt. Vincent and the GrenadinesSudanSwedenSwitzerlandSyriaTaiwanThailandTrinidad and TobagoTurkeyUgandaUkraineUruguayUzbekistanVenezuelaVietnamWest IndiesWestern AfricaWestern AsiaWestern EuropeYemenZaireZimbabweAzores
Immigrants from Denmark
Race
Ancestry
AfghanAfricanAlaska NativeAlaskan AthabascanAlbanianAleutAlsatianAmericanApacheArabArapahoArgentineanArmenianAssyrian/Chaldean/SyriacAustralianAustrianBahamianBangladeshiBarbadianBasqueBelgianBelizeanBermudanBhutaneseBlackfeetBolivianBrazilianBritishBritish West IndianBulgarianBurmeseCambodianCanadianCape VerdeanCarpatho RusynCelticCentral AmericanCentral American IndianCherokeeCheyenneChickasawChileanChineseChippewaChoctawColombianColvilleComancheCosta RicanCreeCreekCroatianCrowCubanCypriotCzechCzechoslovakianDanishDelawareDominicanDutchDutch West IndianEastern EuropeanEcuadorianEgyptianEnglishEstonianEthiopianEuropeanFijianFilipinoFinnishFrenchFrench American IndianFrench CanadianGermanGerman RussianGhanaianGreekGuamanian/ChamorroGuatemalanGuyaneseHaitianHmongHonduranHopiHoumaHungarianIcelanderIndian (Asian)IndonesianInupiatIranianIraqiIrishIroquoisIsraeliItalianJamaicanJapaneseJordanianKenyanKiowaKoreanLaotianLatvianLebaneseLiberianLithuanianLumbeeLuxembourgerMacedonianMalaysianMalteseMarshalleseMenomineeMexicanMexican American IndianMongolianMoroccanNative HawaiianNavajoNepaleseNew ZealanderNicaraguanNigerianNorthern EuropeanNorwegianOkinawanOsageOttawaPaiutePakistaniPalestinianPanamanianParaguayanPennsylvania GermanPeruvianPimaPolishPortuguesePotawatomiPuebloPuerto RicanPuget Sound SalishRomanianRussianSalvadoranSamoanScandinavianScotch-IrishScottishSeminoleSenegaleseSerbianShoshoneSierra LeoneanSiouxSlavicSlovakSloveneSomaliSouth AfricanSouth AmericanSouth American IndianSoviet UnionSpaniardSpanishSpanish AmericanSpanish American IndianSri LankanSubsaharan AfricanSudaneseSwedishSwissSyrianTaiwaneseThaiTlingit-HaidaTohono O'OdhamTonganTrinidadian and TobagonianTsimshianTurkishU.S. Virgin IslanderUgandanUkrainianUruguayanUteVenezuelanVietnameseWelshWest IndianYakamaYaquiYugoslavianYumanYup'ikZimbabwean
Immigration
NonimmigrantsImmigrantsAfghanistanAfricaAlbaniaArgentinaArmeniaAsiaAustraliaAustriaBahamasBangladeshBarbadosBelarusBelgiumBelizeBoliviaBosnia and HerzegovinaBrazilBulgariaBurma/MyanmarCabo VerdeCambodiaCameroonCanadaCaribbeanCentral AmericaChileChinaColombiaCongoCosta RicaCroatiaCubaCzechoslovakiaDenmarkDominicaDominican RepublicEastern AfricaEastern AsiaEastern EuropeEcuadorEgyptEl SalvadorEnglandEritreaEthiopiaEuropeFijiFranceGermanyGhanaGreeceGrenadaGuatemalaGuyanaHaitiHondurasHong KongHungaryIndiaIndonesiaIranIraqIrelandIsraelItalyJamaicaJapanJordanKazakhstanKenyaKoreaKuwaitLaosLatin AmericaLatviaLebanonLiberiaLithuaniaMalaysiaMexicoMicronesiaMiddle AfricaMoldovaMoroccoNepalNetherlandsNicaraguaNigeriaNorth AmericaNorth MacedoniaNorthern AfricaNorthern EuropeNorwayOceaniaPakistanPanamaPeruPhilippinesPolandPortugalRomaniaRussiaSaudi ArabiaScotlandSenegalSerbiaSierra LeoneSingaporeSomaliaSouth AfricaSouth AmericaSouth Central AsiaSouth Eastern AsiaSouthern EuropeSpainSri LankaSt. Vincent and the GrenadinesSudanSwedenSwitzerlandSyriaTaiwanThailandTrinidad and TobagoTurkeyUgandaUkraineUruguayUzbekistanVenezuelaVietnamWest IndiesWestern AfricaWestern AsiaWestern EuropeYemenZaireZimbabweAzores
Single Father Households
Income
Poverty
Unemployment
Labor Participation
Family Structure
Vehicle Availability
Education Level
Disability

Single Father Households Comparison

Cajuns

Immigrants from Denmark

Tragic
Exceptional
2.5%
SINGLE FATHER HOUSEHOLDS
6.1/ 100
METRIC RATING
236th/ 347
METRIC RANK
2.1%
SINGLE FATHER HOUSEHOLDS
99.8/ 100
METRIC RATING
68th/ 347
METRIC RANK

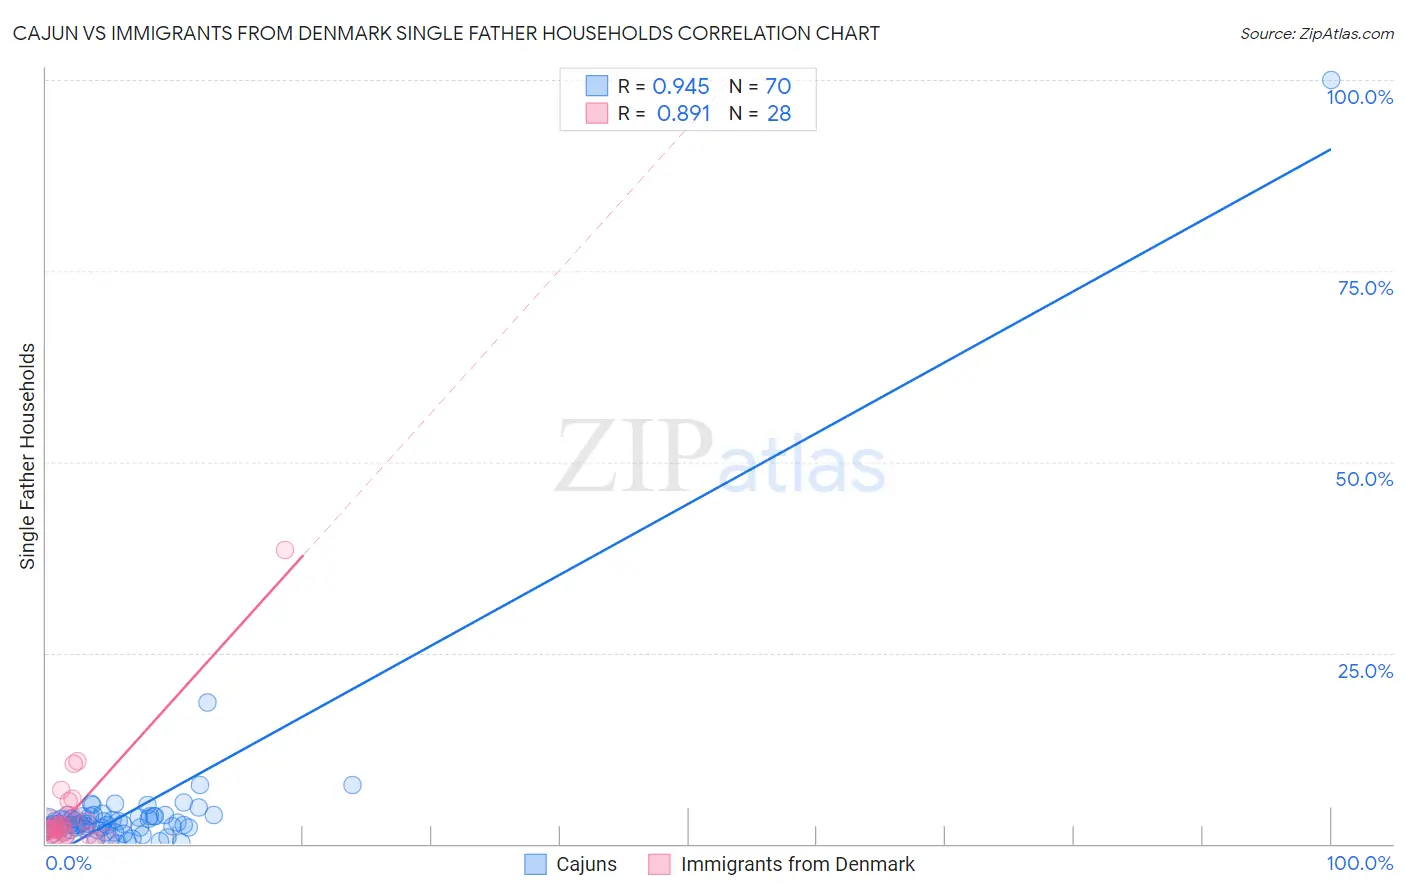
Cajun vs Immigrants from Denmark Single Father Households Correlation Chart

The statistical analysis conducted on geographies consisting of 148,931,799 people shows a near-perfect positive correlation between the proportion of Cajuns and percentage of single father households in the United States with a correlation coefficient (R) of 0.945 and weighted average of 2.5%. Similarly, the statistical analysis conducted on geographies consisting of 135,813,845 people shows a very strong positive correlation between the proportion of Immigrants from Denmark and percentage of single father households in the United States with a correlation coefficient (R) of 0.891 and weighted average of 2.1%, a difference of 19.0%.
Cajun vs Immigrants from Denmark Single Father Households

Single Father Households Correlation Summary

MeasurementCajunImmigrants from Denmark
Minimum0.066%0.35%
Maximum100.0%38.5%
Range99.9%38.1%
Mean4.4%4.3%
Median2.6%2.0%
Interquartile 25% (IQ1)2.1%1.5%
Interquartile 75% (IQ3)3.6%3.6%
Interquartile Range (IQR)1.5%2.1%
Standard Deviation (Sample)11.8%7.2%
Standard Deviation (Population)11.8%7.1%

Similar Demographics by Single Father Households

Demographics Similar to Cajuns by Single Father Households

In terms of single father households, the demographic groups most similar to Cajuns are Immigrants (2.5%, a difference of 0.050%), Sierra Leonean (2.5%, a difference of 0.050%), African (2.5%, a difference of 0.070%), Immigrants from Sierra Leone (2.5%, a difference of 0.080%), and Immigrants from Oceania (2.5%, a difference of 0.090%).
DemographicsRating | RankSingle Father Households
Immigrants | Zaire
8.6
/100
|
#229
Tragic
2.4%
Sub-Saharan Africans
8.3
/100
|
#230
Tragic
2.4%
Immigrants | Nonimmigrants
7.6
/100
|
#231
Tragic
2.4%
Pennsylvania Germans
7.3
/100
|
#232
Tragic
2.4%
Immigrants | Western Africa
7.0
/100
|
#233
Tragic
2.4%
Africans
6.3
/100
|
#234
Tragic
2.5%
Immigrants | Immigrants
6.3
/100
|
#235
Tragic
2.5%
Cajuns
6.1
/100
|
#236
Tragic
2.5%
Sierra Leoneans
5.9
/100
|
#237
Tragic
2.5%
Immigrants | Sierra Leone
5.8
/100
|
#238
Tragic
2.5%
Immigrants | Oceania
5.8
/100
|
#239
Tragic
2.5%
Immigrants | Dominica
4.8
/100
|
#240
Tragic
2.5%
Portuguese
4.1
/100
|
#241
Tragic
2.5%
Osage
4.1
/100
|
#242
Tragic
2.5%
Spaniards
3.1
/100
|
#243
Tragic
2.5%

Demographics Similar to Immigrants from Denmark by Single Father Households

In terms of single father households, the demographic groups most similar to Immigrants from Denmark are Immigrants from Romania (2.1%, a difference of 0.020%), Immigrants from Italy (2.1%, a difference of 0.090%), Immigrants from Western Asia (2.1%, a difference of 0.14%), Egyptian (2.1%, a difference of 0.23%), and Immigrants from Kuwait (2.1%, a difference of 0.24%).
DemographicsRating | RankSingle Father Households
Vietnamese
99.9
/100
|
#61
Exceptional
2.0%
Immigrants | Malaysia
99.9
/100
|
#62
Exceptional
2.0%
Maltese
99.9
/100
|
#63
Exceptional
2.0%
Mongolians
99.9
/100
|
#64
Exceptional
2.1%
Paraguayans
99.9
/100
|
#65
Exceptional
2.1%
Immigrants | Western Asia
99.8
/100
|
#66
Exceptional
2.1%
Immigrants | Italy
99.8
/100
|
#67
Exceptional
2.1%
Immigrants | Denmark
99.8
/100
|
#68
Exceptional
2.1%
Immigrants | Romania
99.8
/100
|
#69
Exceptional
2.1%
Egyptians
99.8
/100
|
#70
Exceptional
2.1%
Immigrants | Kuwait
99.8
/100
|
#71
Exceptional
2.1%
Immigrants | Spain
99.8
/100
|
#72
Exceptional
2.1%
Immigrants | Bangladesh
99.8
/100
|
#73
Exceptional
2.1%
Immigrants | Egypt
99.8
/100
|
#74
Exceptional
2.1%
Immigrants | Sweden
99.8
/100
|
#75
Exceptional
2.1%