Cajun vs Iraqi Single Father Households

COMPARE

Cajun
Race
Ancestry
AfghanAfricanAlaska NativeAlaskan AthabascanAlbanianAleutAlsatianAmericanApacheArabArapahoArgentineanArmenianAssyrian/Chaldean/SyriacAustralianAustrianBahamianBangladeshiBarbadianBasqueBelgianBelizeanBermudanBhutaneseBlackfeetBolivianBrazilianBritishBritish West IndianBulgarianBurmeseCajunCambodianCanadianCape VerdeanCarpatho RusynCelticCentral AmericanCentral American IndianCherokeeCheyenneChickasawChileanChineseChippewaChoctawColombianColvilleComancheCosta RicanCreeCreekCroatianCrowCubanCypriotCzechCzechoslovakianDanishDelawareDominicanDutchDutch West IndianEastern EuropeanEcuadorianEgyptianEnglishEstonianEthiopianEuropeanFijianFilipinoFinnishFrenchFrench American IndianFrench CanadianGermanGerman RussianGhanaianGreekGuamanian/ChamorroGuatemalanGuyaneseHaitianHmongHonduranHopiHoumaHungarianIcelanderIndian (Asian)IndonesianInupiatIranianIrishIroquoisIsraeliItalianJamaicanJapaneseJordanianKenyanKiowaKoreanLaotianLatvianLebaneseLiberianLithuanianLumbeeLuxembourgerMacedonianMalaysianMalteseMarshalleseMenomineeMexicanMexican American IndianMongolianMoroccanNative HawaiianNavajoNepaleseNew ZealanderNicaraguanNigerianNorthern EuropeanNorwegianOkinawanOsageOttawaPaiutePakistaniPalestinianPanamanianParaguayanPennsylvania GermanPeruvianPimaPolishPortuguesePotawatomiPuebloPuerto RicanPuget Sound SalishRomanianRussianSalvadoranSamoanScandinavianScotch-IrishScottishSeminoleSenegaleseSerbianShoshoneSierra LeoneanSiouxSlavicSlovakSloveneSomaliSouth AfricanSouth AmericanSouth American IndianSoviet UnionSpaniardSpanishSpanish AmericanSpanish American IndianSri LankanSubsaharan AfricanSudaneseSwedishSwissSyrianTaiwaneseThaiTlingit-HaidaTohono O'OdhamTonganTrinidadian and TobagonianTsimshianTurkishU.S. Virgin IslanderUgandanUkrainianUruguayanUteVenezuelanVietnameseWelshWest IndianYakamaYaquiYugoslavianYumanYup'ikZimbabwean
Immigration
NonimmigrantsImmigrantsAfghanistanAfricaAlbaniaArgentinaArmeniaAsiaAustraliaAustriaBahamasBangladeshBarbadosBelarusBelgiumBelizeBoliviaBosnia and HerzegovinaBrazilBulgariaBurma/MyanmarCabo VerdeCambodiaCameroonCanadaCaribbeanCentral AmericaChileChinaColombiaCongoCosta RicaCroatiaCubaCzechoslovakiaDenmarkDominicaDominican RepublicEastern AfricaEastern AsiaEastern EuropeEcuadorEgyptEl SalvadorEnglandEritreaEthiopiaEuropeFijiFranceGermanyGhanaGreeceGrenadaGuatemalaGuyanaHaitiHondurasHong KongHungaryIndiaIndonesiaIranIraqIrelandIsraelItalyJamaicaJapanJordanKazakhstanKenyaKoreaKuwaitLaosLatin AmericaLatviaLebanonLiberiaLithuaniaMalaysiaMexicoMicronesiaMiddle AfricaMoldovaMoroccoNepalNetherlandsNicaraguaNigeriaNorth AmericaNorth MacedoniaNorthern AfricaNorthern EuropeNorwayOceaniaPakistanPanamaPeruPhilippinesPolandPortugalRomaniaRussiaSaudi ArabiaScotlandSenegalSerbiaSierra LeoneSingaporeSomaliaSouth AfricaSouth AmericaSouth Central AsiaSouth Eastern AsiaSouthern EuropeSpainSri LankaSt. Vincent and the GrenadinesSudanSwedenSwitzerlandSyriaTaiwanThailandTrinidad and TobagoTurkeyUgandaUkraineUruguayUzbekistanVenezuelaVietnamWest IndiesWestern AfricaWestern AsiaWestern EuropeYemenZaireZimbabweAzores
Iraqi
Race
Ancestry
AfghanAfricanAlaska NativeAlaskan AthabascanAlbanianAleutAlsatianAmericanApacheArabArapahoArgentineanArmenianAssyrian/Chaldean/SyriacAustralianAustrianBahamianBangladeshiBarbadianBasqueBelgianBelizeanBermudanBhutaneseBlackfeetBolivianBrazilianBritishBritish West IndianBulgarianBurmeseCambodianCanadianCape VerdeanCarpatho RusynCelticCentral AmericanCentral American IndianCherokeeCheyenneChickasawChileanChineseChippewaChoctawColombianColvilleComancheCosta RicanCreeCreekCroatianCrowCubanCypriotCzechCzechoslovakianDanishDelawareDominicanDutchDutch West IndianEastern EuropeanEcuadorianEgyptianEnglishEstonianEthiopianEuropeanFijianFilipinoFinnishFrenchFrench American IndianFrench CanadianGermanGerman RussianGhanaianGreekGuamanian/ChamorroGuatemalanGuyaneseHaitianHmongHonduranHopiHoumaHungarianIcelanderIndian (Asian)IndonesianInupiatIranianIraqiIrishIroquoisIsraeliItalianJamaicanJapaneseJordanianKenyanKiowaKoreanLaotianLatvianLebaneseLiberianLithuanianLumbeeLuxembourgerMacedonianMalaysianMalteseMarshalleseMenomineeMexicanMexican American IndianMongolianMoroccanNative HawaiianNavajoNepaleseNew ZealanderNicaraguanNigerianNorthern EuropeanNorwegianOkinawanOsageOttawaPaiutePakistaniPalestinianPanamanianParaguayanPennsylvania GermanPeruvianPimaPolishPortuguesePotawatomiPuebloPuerto RicanPuget Sound SalishRomanianRussianSalvadoranSamoanScandinavianScotch-IrishScottishSeminoleSenegaleseSerbianShoshoneSierra LeoneanSiouxSlavicSlovakSloveneSomaliSouth AfricanSouth AmericanSouth American IndianSoviet UnionSpaniardSpanishSpanish AmericanSpanish American IndianSri LankanSubsaharan AfricanSudaneseSwedishSwissSyrianTaiwaneseThaiTlingit-HaidaTohono O'OdhamTonganTrinidadian and TobagonianTsimshianTurkishU.S. Virgin IslanderUgandanUkrainianUruguayanUteVenezuelanVietnameseWelshWest IndianYakamaYaquiYugoslavianYumanYup'ikZimbabwean
Immigration
NonimmigrantsImmigrantsAfghanistanAfricaAlbaniaArgentinaArmeniaAsiaAustraliaAustriaBahamasBangladeshBarbadosBelarusBelgiumBelizeBoliviaBosnia and HerzegovinaBrazilBulgariaBurma/MyanmarCabo VerdeCambodiaCameroonCanadaCaribbeanCentral AmericaChileChinaColombiaCongoCosta RicaCroatiaCubaCzechoslovakiaDenmarkDominicaDominican RepublicEastern AfricaEastern AsiaEastern EuropeEcuadorEgyptEl SalvadorEnglandEritreaEthiopiaEuropeFijiFranceGermanyGhanaGreeceGrenadaGuatemalaGuyanaHaitiHondurasHong KongHungaryIndiaIndonesiaIranIraqIrelandIsraelItalyJamaicaJapanJordanKazakhstanKenyaKoreaKuwaitLaosLatin AmericaLatviaLebanonLiberiaLithuaniaMalaysiaMexicoMicronesiaMiddle AfricaMoldovaMoroccoNepalNetherlandsNicaraguaNigeriaNorth AmericaNorth MacedoniaNorthern AfricaNorthern EuropeNorwayOceaniaPakistanPanamaPeruPhilippinesPolandPortugalRomaniaRussiaSaudi ArabiaScotlandSenegalSerbiaSierra LeoneSingaporeSomaliaSouth AfricaSouth AmericaSouth Central AsiaSouth Eastern AsiaSouthern EuropeSpainSri LankaSt. Vincent and the GrenadinesSudanSwedenSwitzerlandSyriaTaiwanThailandTrinidad and TobagoTurkeyUgandaUkraineUruguayUzbekistanVenezuelaVietnamWest IndiesWestern AfricaWestern AsiaWestern EuropeYemenZaireZimbabweAzores
Single Father Households
Income
Poverty
Unemployment
Labor Participation
Family Structure
Vehicle Availability
Education Level
Disability

Single Father Households Comparison

Cajuns

Iraqis

Tragic
Exceptional
2.5%
SINGLE FATHER HOUSEHOLDS
6.1/ 100
METRIC RATING
236th/ 347
METRIC RANK
2.2%
SINGLE FATHER HOUSEHOLDS
98.2/ 100
METRIC RATING
113th/ 347
METRIC RANK

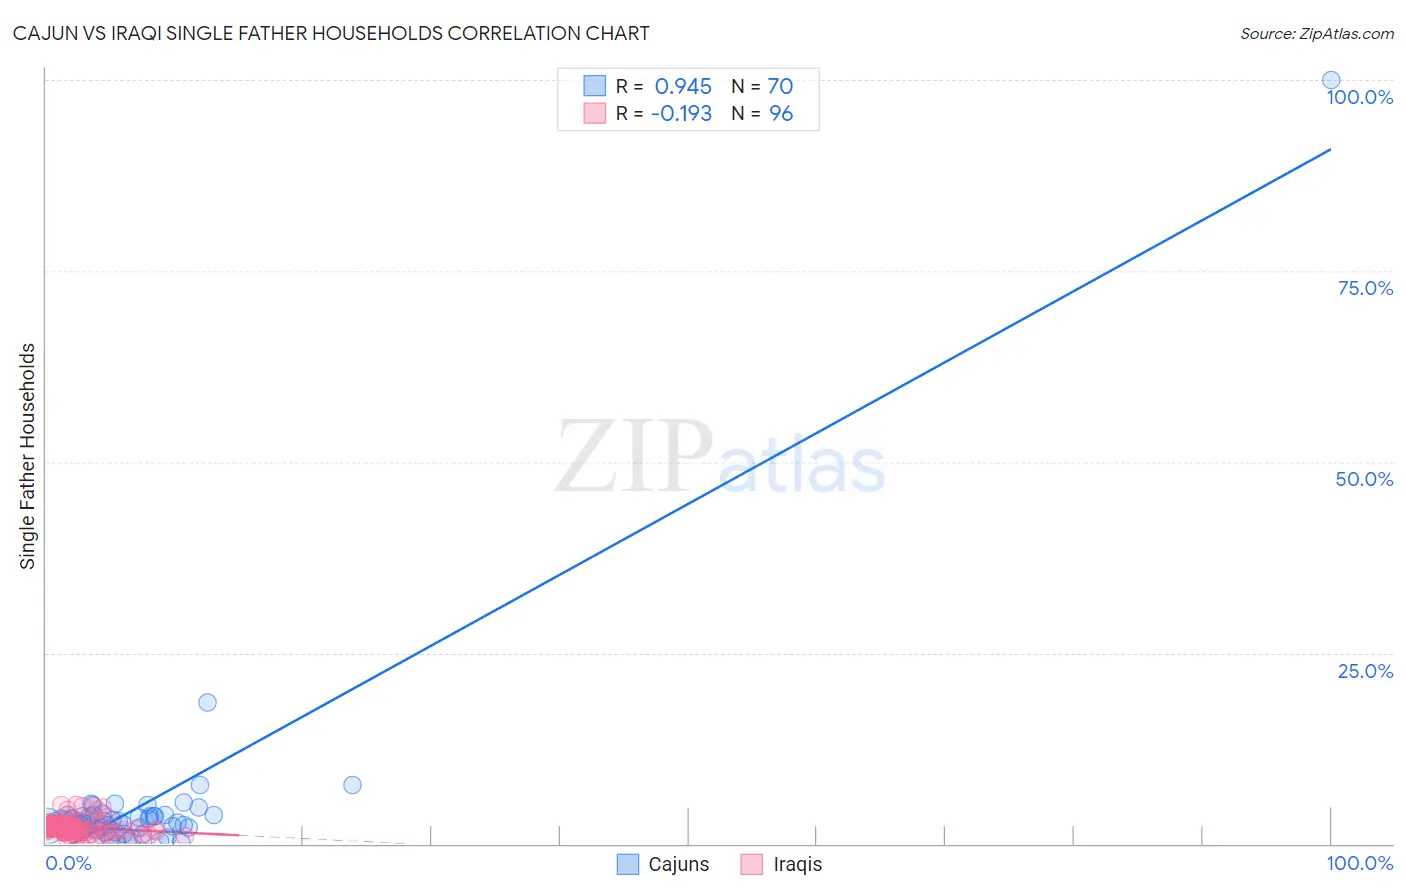
Cajun vs Iraqi Single Father Households Correlation Chart

The statistical analysis conducted on geographies consisting of 148,931,799 people shows a near-perfect positive correlation between the proportion of Cajuns and percentage of single father households in the United States with a correlation coefficient (R) of 0.945 and weighted average of 2.5%. Similarly, the statistical analysis conducted on geographies consisting of 170,092,363 people shows a poor negative correlation between the proportion of Iraqis and percentage of single father households in the United States with a correlation coefficient (R) of -0.193 and weighted average of 2.2%, a difference of 13.4%.
Cajun vs Iraqi Single Father Households

Single Father Households Correlation Summary

MeasurementCajunIraqi
Minimum0.066%0.33%
Maximum100.0%5.1%
Range99.9%4.7%
Mean4.4%2.2%
Median2.6%2.2%
Interquartile 25% (IQ1)2.1%1.6%
Interquartile 75% (IQ3)3.6%2.4%
Interquartile Range (IQR)1.5%0.81%
Standard Deviation (Sample)11.8%0.93%
Standard Deviation (Population)11.8%0.93%

Similar Demographics by Single Father Households

Demographics Similar to Cajuns by Single Father Households

In terms of single father households, the demographic groups most similar to Cajuns are Immigrants (2.5%, a difference of 0.050%), Sierra Leonean (2.5%, a difference of 0.050%), African (2.5%, a difference of 0.070%), Immigrants from Sierra Leone (2.5%, a difference of 0.080%), and Immigrants from Oceania (2.5%, a difference of 0.090%).
DemographicsRating | RankSingle Father Households
Immigrants | Zaire
8.6
/100
|
#229
Tragic
2.4%
Sub-Saharan Africans
8.3
/100
|
#230
Tragic
2.4%
Immigrants | Nonimmigrants
7.6
/100
|
#231
Tragic
2.4%
Pennsylvania Germans
7.3
/100
|
#232
Tragic
2.4%
Immigrants | Western Africa
7.0
/100
|
#233
Tragic
2.4%
Africans
6.3
/100
|
#234
Tragic
2.5%
Immigrants | Immigrants
6.3
/100
|
#235
Tragic
2.5%
Cajuns
6.1
/100
|
#236
Tragic
2.5%
Sierra Leoneans
5.9
/100
|
#237
Tragic
2.5%
Immigrants | Sierra Leone
5.8
/100
|
#238
Tragic
2.5%
Immigrants | Oceania
5.8
/100
|
#239
Tragic
2.5%
Immigrants | Dominica
4.8
/100
|
#240
Tragic
2.5%
Portuguese
4.1
/100
|
#241
Tragic
2.5%
Osage
4.1
/100
|
#242
Tragic
2.5%
Spaniards
3.1
/100
|
#243
Tragic
2.5%

Demographics Similar to Iraqis by Single Father Households

In terms of single father households, the demographic groups most similar to Iraqis are Immigrants from Trinidad and Tobago (2.2%, a difference of 0.010%), Immigrants from North America (2.2%, a difference of 0.040%), Immigrants from Canada (2.2%, a difference of 0.050%), Immigrants from Barbados (2.2%, a difference of 0.070%), and Immigrants from Argentina (2.2%, a difference of 0.10%).
DemographicsRating | RankSingle Father Households
Immigrants | Southern Europe
98.6
/100
|
#106
Exceptional
2.2%
Slovenes
98.5
/100
|
#107
Exceptional
2.2%
Immigrants | Netherlands
98.5
/100
|
#108
Exceptional
2.2%
Barbadians
98.4
/100
|
#109
Exceptional
2.2%
Italians
98.3
/100
|
#110
Exceptional
2.2%
Immigrants | Canada
98.3
/100
|
#111
Exceptional
2.2%
Immigrants | Trinidad and Tobago
98.2
/100
|
#112
Exceptional
2.2%
Iraqis
98.2
/100
|
#113
Exceptional
2.2%
Immigrants | North America
98.2
/100
|
#114
Exceptional
2.2%
Immigrants | Barbados
98.2
/100
|
#115
Exceptional
2.2%
Immigrants | Argentina
98.1
/100
|
#116
Exceptional
2.2%
Hungarians
97.9
/100
|
#117
Exceptional
2.2%
Immigrants | Morocco
97.8
/100
|
#118
Exceptional
2.2%
Trinidadians and Tobagonians
97.8
/100
|
#119
Exceptional
2.2%
Australians
97.7
/100
|
#120
Exceptional
2.2%