Cajun vs Immigrants from Fiji Single Father Households
COMPARE
Cajun
Immigrants from Fiji
Single Father Households
Single Father Households Comparison
Cajuns
Immigrants from Fiji
2.5%
SINGLE FATHER HOUSEHOLDS
6.1/ 100
METRIC RATING
236th/ 347
METRIC RANK
2.7%
SINGLE FATHER HOUSEHOLDS
0.0/ 100
METRIC RATING
293rd/ 347
METRIC RANK
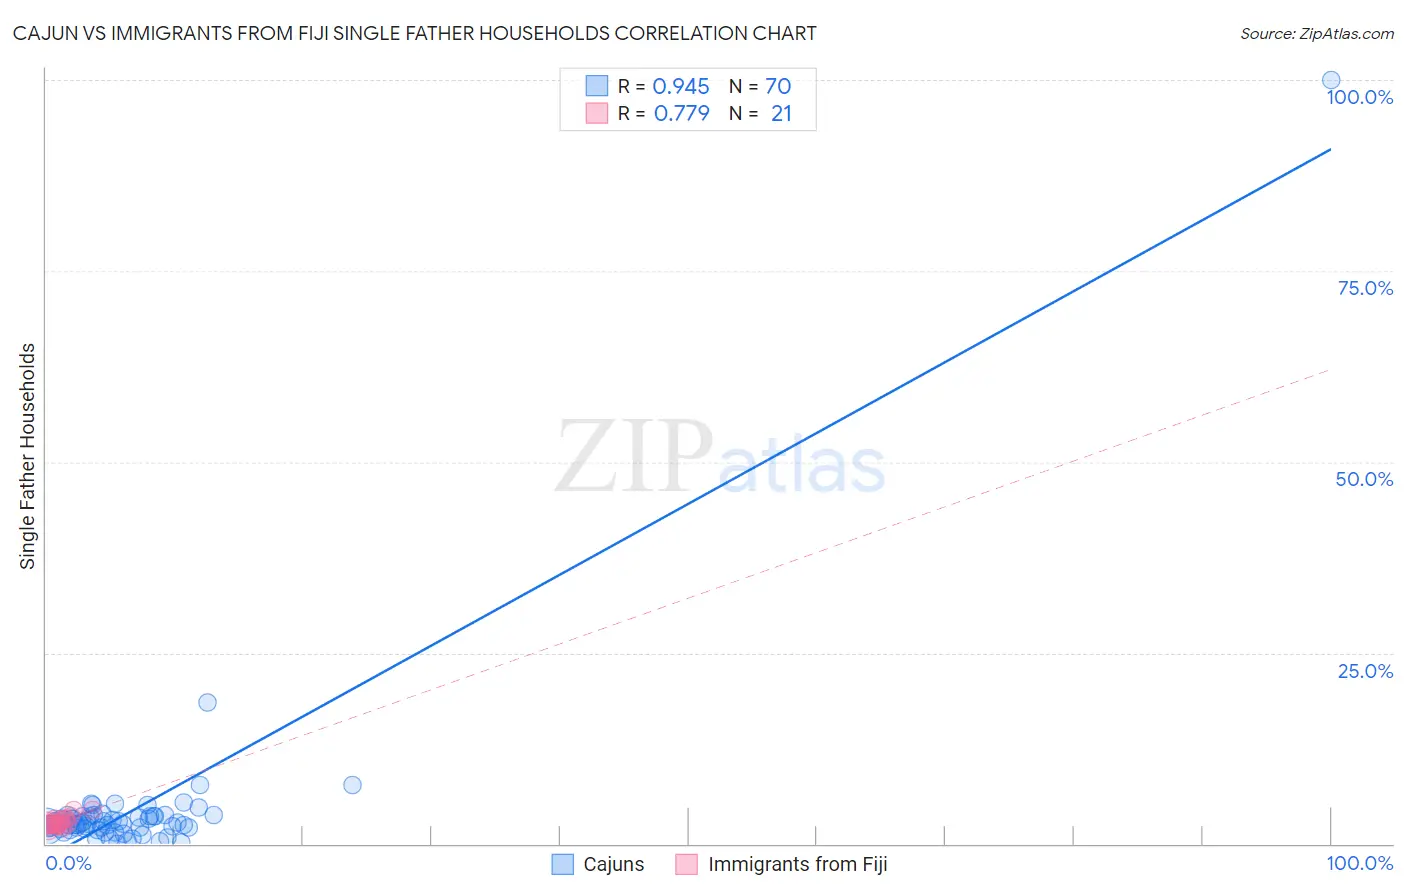
Cajun vs Immigrants from Fiji Single Father Households Correlation Chart
The statistical analysis conducted on geographies consisting of 148,931,799 people shows a near-perfect positive correlation between the proportion of Cajuns and percentage of single father households in the United States with a correlation coefficient (R) of 0.945 and weighted average of 2.5%. Similarly, the statistical analysis conducted on geographies consisting of 93,616,841 people shows a strong positive correlation between the proportion of Immigrants from Fiji and percentage of single father households in the United States with a correlation coefficient (R) of 0.779 and weighted average of 2.7%, a difference of 10.7%.
Single Father Households Correlation Summary
| Measurement | Cajun | Immigrants from Fiji |
| Minimum | 0.066% | 2.1% |
| Maximum | 100.0% | 4.5% |
| Range | 99.9% | 2.3% |
| Mean | 4.4% | 2.9% |
| Median | 2.6% | 2.6% |
| Interquartile 25% (IQ1) | 2.1% | 2.4% |
| Interquartile 75% (IQ3) | 3.6% | 3.2% |
| Interquartile Range (IQR) | 1.5% | 0.81% |
| Standard Deviation (Sample) | 11.8% | 0.64% |
| Standard Deviation (Population) | 11.8% | 0.63% |
Similar Demographics by Single Father Households
Demographics Similar to Cajuns by Single Father Households
In terms of single father households, the demographic groups most similar to Cajuns are Immigrants (2.5%, a difference of 0.050%), Sierra Leonean (2.5%, a difference of 0.050%), African (2.5%, a difference of 0.070%), Immigrants from Sierra Leone (2.5%, a difference of 0.080%), and Immigrants from Oceania (2.5%, a difference of 0.090%).
| Demographics | Rating | Rank | Single Father Households |
| Immigrants | Zaire | 8.6 /100 | #229 | Tragic 2.4% |
| Sub-Saharan Africans | 8.3 /100 | #230 | Tragic 2.4% |
| Immigrants | Nonimmigrants | 7.6 /100 | #231 | Tragic 2.4% |
| Pennsylvania Germans | 7.3 /100 | #232 | Tragic 2.4% |
| Immigrants | Western Africa | 7.0 /100 | #233 | Tragic 2.4% |
| Africans | 6.3 /100 | #234 | Tragic 2.5% |
| Immigrants | Immigrants | 6.3 /100 | #235 | Tragic 2.5% |
| Cajuns | 6.1 /100 | #236 | Tragic 2.5% |
| Sierra Leoneans | 5.9 /100 | #237 | Tragic 2.5% |
| Immigrants | Sierra Leone | 5.8 /100 | #238 | Tragic 2.5% |
| Immigrants | Oceania | 5.8 /100 | #239 | Tragic 2.5% |
| Immigrants | Dominica | 4.8 /100 | #240 | Tragic 2.5% |
| Portuguese | 4.1 /100 | #241 | Tragic 2.5% |
| Osage | 4.1 /100 | #242 | Tragic 2.5% |
| Spaniards | 3.1 /100 | #243 | Tragic 2.5% |
Demographics Similar to Immigrants from Fiji by Single Father Households
In terms of single father households, the demographic groups most similar to Immigrants from Fiji are Choctaw (2.7%, a difference of 0.16%), Malaysian (2.7%, a difference of 0.43%), Blackfeet (2.7%, a difference of 0.62%), Puget Sound Salish (2.7%, a difference of 1.2%), and Chickasaw (2.8%, a difference of 1.2%).
| Demographics | Rating | Rank | Single Father Households |
| Immigrants | Cuba | 0.1 /100 | #286 | Tragic 2.7% |
| Central American Indians | 0.0 /100 | #287 | Tragic 2.7% |
| Immigrants | Cambodia | 0.0 /100 | #288 | Tragic 2.7% |
| Tlingit-Haida | 0.0 /100 | #289 | Tragic 2.7% |
| Puget Sound Salish | 0.0 /100 | #290 | Tragic 2.7% |
| Blackfeet | 0.0 /100 | #291 | Tragic 2.7% |
| Choctaw | 0.0 /100 | #292 | Tragic 2.7% |
| Immigrants | Fiji | 0.0 /100 | #293 | Tragic 2.7% |
| Malaysians | 0.0 /100 | #294 | Tragic 2.7% |
| Chickasaw | 0.0 /100 | #295 | Tragic 2.8% |
| Japanese | 0.0 /100 | #296 | Tragic 2.8% |
| Hondurans | 0.0 /100 | #297 | Tragic 2.8% |
| Cree | 0.0 /100 | #298 | Tragic 2.8% |
| Lumbee | 0.0 /100 | #299 | Tragic 2.8% |
| Kiowa | 0.0 /100 | #300 | Tragic 2.8% |