Irish vs Turkish Single Father Households
COMPARE
Irish
Turkish
Single Father Households
Single Father Households Comparison
Irish
Turks
2.3%
SINGLE FATHER HOUSEHOLDS
72.1/ 100
METRIC RATING
163rd/ 347
METRIC RANK
2.0%
SINGLE FATHER HOUSEHOLDS
100.0/ 100
METRIC RATING
33rd/ 347
METRIC RANK
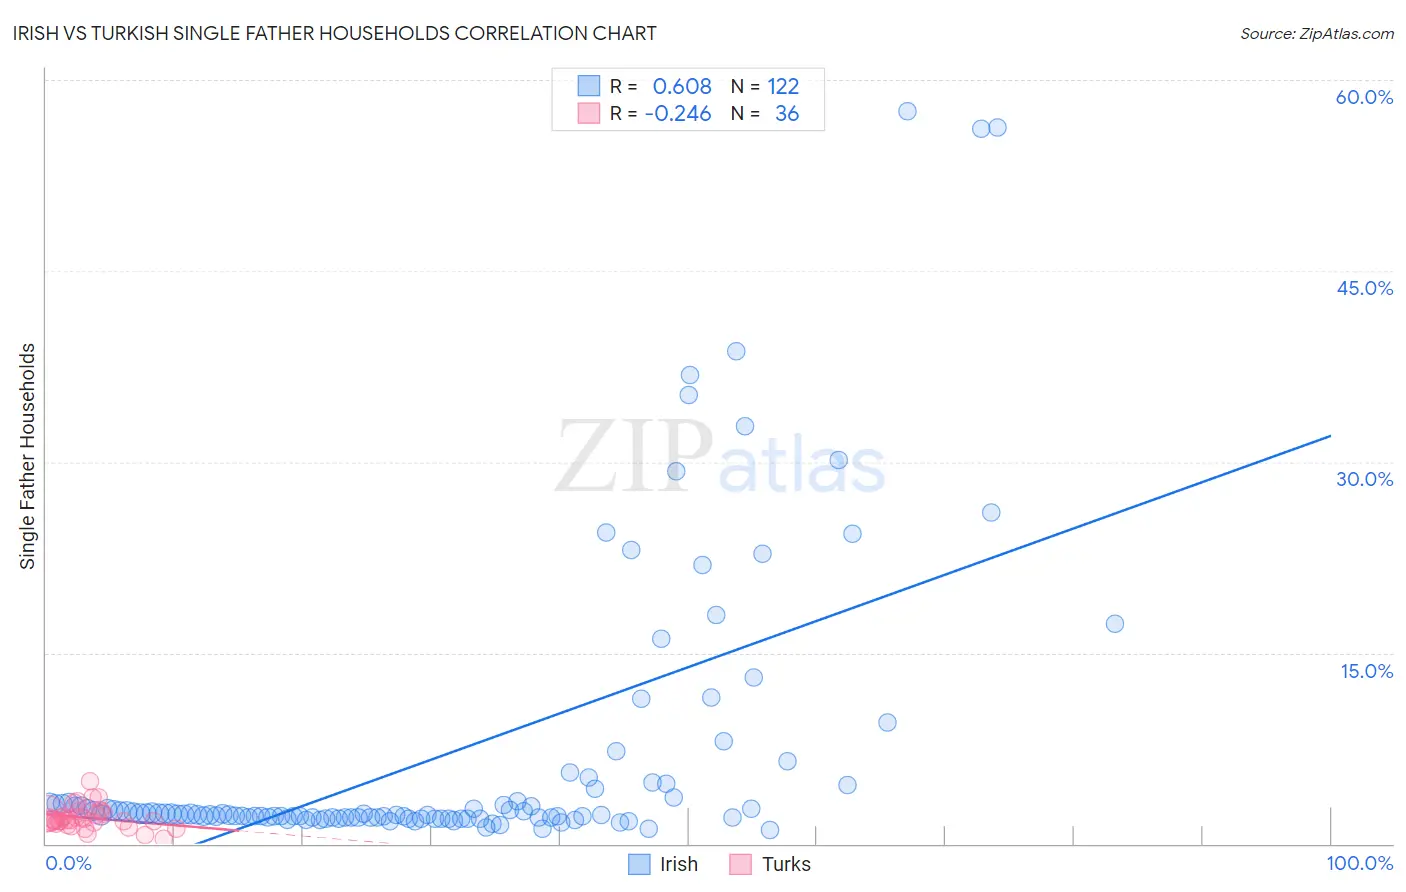
Irish vs Turkish Single Father Households Correlation Chart
The statistical analysis conducted on geographies consisting of 562,350,400 people shows a significant positive correlation between the proportion of Irish and percentage of single father households in the United States with a correlation coefficient (R) of 0.608 and weighted average of 2.3%. Similarly, the statistical analysis conducted on geographies consisting of 270,298,276 people shows a weak negative correlation between the proportion of Turks and percentage of single father households in the United States with a correlation coefficient (R) of -0.246 and weighted average of 2.0%, a difference of 16.2%.
Single Father Households Correlation Summary
| Measurement | Irish | Turkish |
| Minimum | 1.1% | 0.37% |
| Maximum | 57.5% | 5.0% |
| Range | 56.4% | 4.6% |
| Mean | 7.1% | 2.0% |
| Median | 2.3% | 1.9% |
| Interquartile 25% (IQ1) | 2.1% | 1.6% |
| Interquartile 75% (IQ3) | 4.3% | 2.3% |
| Interquartile Range (IQR) | 2.3% | 0.70% |
| Standard Deviation (Sample) | 11.5% | 0.89% |
| Standard Deviation (Population) | 11.4% | 0.88% |
Similar Demographics by Single Father Households
Demographics Similar to Irish by Single Father Households
In terms of single father households, the demographic groups most similar to Irish are Scottish (2.3%, a difference of 0.070%), Swiss (2.3%, a difference of 0.11%), Pakistani (2.3%, a difference of 0.14%), Scotch-Irish (2.3%, a difference of 0.24%), and English (2.3%, a difference of 0.31%).
| Demographics | Rating | Rank | Single Father Households |
| Immigrants | South America | 79.9 /100 | #156 | Good 2.3% |
| Canadians | 79.7 /100 | #157 | Good 2.3% |
| Immigrants | Senegal | 79.4 /100 | #158 | Good 2.3% |
| Immigrants | West Indies | 77.9 /100 | #159 | Good 2.3% |
| Immigrants | Bolivia | 76.3 /100 | #160 | Good 2.3% |
| Swiss | 73.2 /100 | #161 | Good 2.3% |
| Scottish | 72.8 /100 | #162 | Good 2.3% |
| Irish | 72.1 /100 | #163 | Good 2.3% |
| Pakistanis | 70.6 /100 | #164 | Good 2.3% |
| Scotch-Irish | 69.4 /100 | #165 | Good 2.3% |
| English | 68.6 /100 | #166 | Good 2.3% |
| South Americans | 64.3 /100 | #167 | Good 2.3% |
| Icelanders | 63.1 /100 | #168 | Good 2.3% |
| Czechs | 62.5 /100 | #169 | Good 2.3% |
| Ugandans | 62.2 /100 | #170 | Good 2.3% |
Demographics Similar to Turks by Single Father Households
In terms of single father households, the demographic groups most similar to Turks are Immigrants from Australia (2.0%, a difference of 0.020%), Chinese (2.0%, a difference of 0.21%), Israeli (2.0%, a difference of 0.25%), Cambodian (2.0%, a difference of 0.28%), and Bulgarian (2.0%, a difference of 0.31%).
| Demographics | Rating | Rank | Single Father Households |
| Assyrians/Chaldeans/Syriacs | 100.0 /100 | #26 | Exceptional 2.0% |
| Immigrants | South Central Asia | 100.0 /100 | #27 | Exceptional 2.0% |
| Immigrants | Japan | 100.0 /100 | #28 | Exceptional 2.0% |
| Bulgarians | 100.0 /100 | #29 | Exceptional 2.0% |
| Cambodians | 100.0 /100 | #30 | Exceptional 2.0% |
| Israelis | 100.0 /100 | #31 | Exceptional 2.0% |
| Chinese | 100.0 /100 | #32 | Exceptional 2.0% |
| Turks | 100.0 /100 | #33 | Exceptional 2.0% |
| Immigrants | Australia | 100.0 /100 | #34 | Exceptional 2.0% |
| Albanians | 100.0 /100 | #35 | Exceptional 2.0% |
| Immigrants | Belgium | 100.0 /100 | #36 | Exceptional 2.0% |
| Immigrants | St. Vincent and the Grenadines | 100.0 /100 | #37 | Exceptional 2.0% |
| Immigrants | Eastern Europe | 100.0 /100 | #38 | Exceptional 2.0% |
| Immigrants | Sri Lanka | 100.0 /100 | #39 | Exceptional 2.0% |
| Immigrants | Bulgaria | 100.0 /100 | #40 | Exceptional 2.0% |