Burmese vs Czechoslovakian Family Households
COMPARE
Burmese
Czechoslovakian
Family Households
Family Households Comparison
Burmese
Czechoslovakians
65.7%
FAMILY HOUSEHOLDS
99.9/ 100
METRIC RATING
74th/ 347
METRIC RANK
64.6%
FAMILY HOUSEHOLDS
82.1/ 100
METRIC RATING
143rd/ 347
METRIC RANK
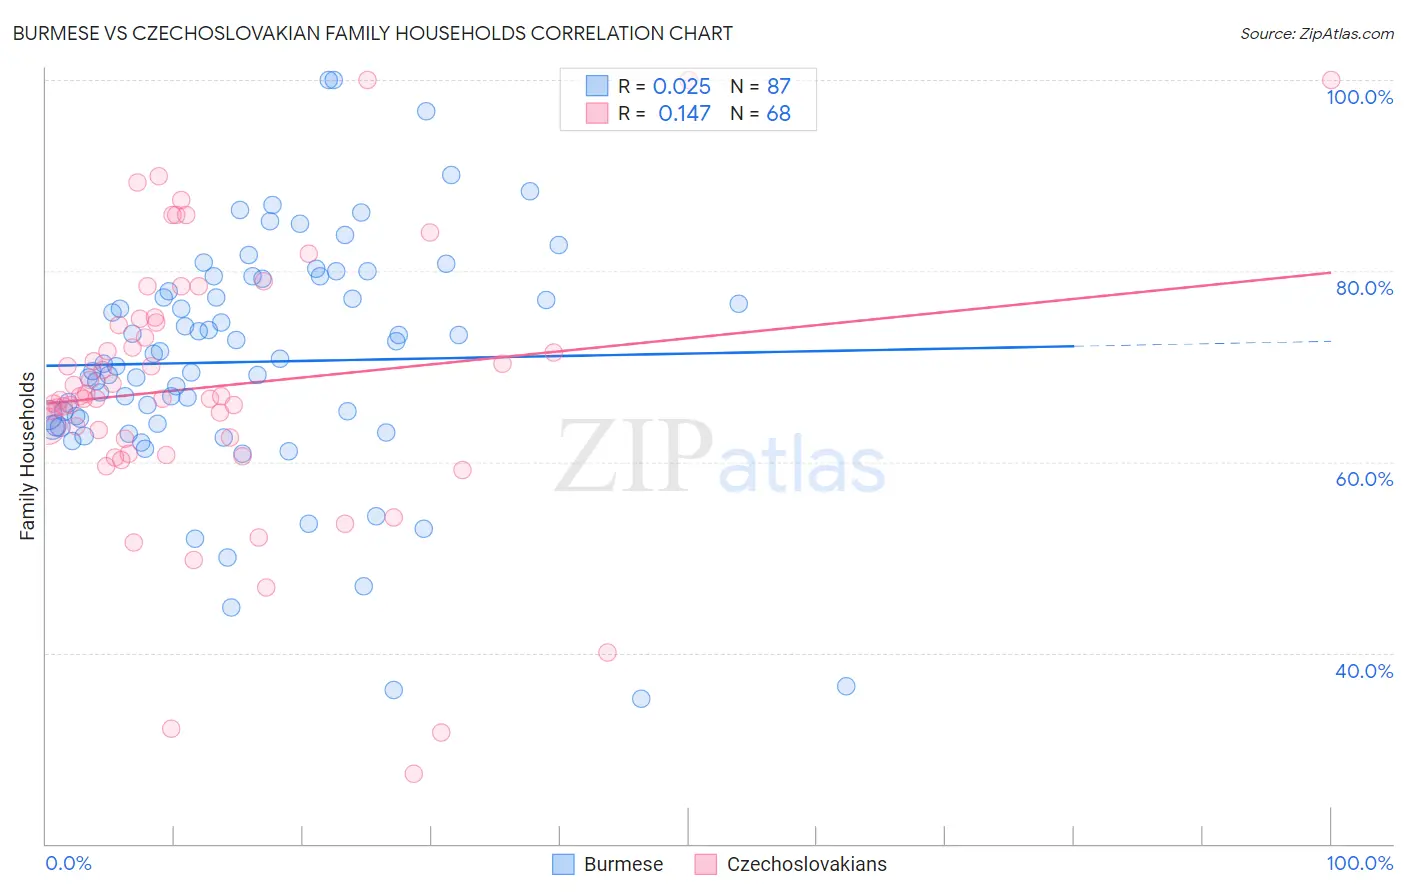
Burmese vs Czechoslovakian Family Households Correlation Chart
The statistical analysis conducted on geographies consisting of 464,897,249 people shows no correlation between the proportion of Burmese and percentage of family households in the United States with a correlation coefficient (R) of 0.025 and weighted average of 65.7%. Similarly, the statistical analysis conducted on geographies consisting of 368,525,502 people shows a poor positive correlation between the proportion of Czechoslovakians and percentage of family households in the United States with a correlation coefficient (R) of 0.147 and weighted average of 64.6%, a difference of 1.7%.
Family Households Correlation Summary
| Measurement | Burmese | Czechoslovakian |
| Minimum | 35.2% | 27.4% |
| Maximum | 100.0% | 100.0% |
| Range | 64.8% | 72.6% |
| Mean | 70.5% | 67.9% |
| Median | 70.3% | 66.7% |
| Interquartile 25% (IQ1) | 63.8% | 61.6% |
| Interquartile 75% (IQ3) | 79.2% | 74.8% |
| Interquartile Range (IQR) | 15.4% | 13.1% |
| Standard Deviation (Sample) | 12.5% | 14.4% |
| Standard Deviation (Population) | 12.5% | 14.3% |
Similar Demographics by Family Households
Demographics Similar to Burmese by Family Households
In terms of family households, the demographic groups most similar to Burmese are Laotian (65.8%, a difference of 0.040%), Houma (65.7%, a difference of 0.050%), Portuguese (65.8%, a difference of 0.11%), Bhutanese (65.9%, a difference of 0.16%), and Immigrants from the Azores (65.6%, a difference of 0.17%).
| Demographics | Rating | Rank | Family Households |
| Filipinos | 99.9 /100 | #67 | Exceptional 65.9% |
| Japanese | 99.9 /100 | #68 | Exceptional 65.9% |
| Malaysians | 99.9 /100 | #69 | Exceptional 65.9% |
| Immigrants | Afghanistan | 99.9 /100 | #70 | Exceptional 65.9% |
| Bhutanese | 99.9 /100 | #71 | Exceptional 65.9% |
| Portuguese | 99.9 /100 | #72 | Exceptional 65.8% |
| Laotians | 99.9 /100 | #73 | Exceptional 65.8% |
| Burmese | 99.9 /100 | #74 | Exceptional 65.7% |
| Houma | 99.9 /100 | #75 | Exceptional 65.7% |
| Immigrants | Azores | 99.8 /100 | #76 | Exceptional 65.6% |
| Immigrants | South America | 99.8 /100 | #77 | Exceptional 65.6% |
| Yaqui | 99.8 /100 | #78 | Exceptional 65.6% |
| Immigrants | Costa Rica | 99.8 /100 | #79 | Exceptional 65.6% |
| Puget Sound Salish | 99.8 /100 | #80 | Exceptional 65.6% |
| Jordanians | 99.7 /100 | #81 | Exceptional 65.5% |
Demographics Similar to Czechoslovakians by Family Households
In terms of family households, the demographic groups most similar to Czechoslovakians are South American Indian (64.6%, a difference of 0.0%), Welsh (64.6%, a difference of 0.040%), Pakistani (64.7%, a difference of 0.050%), Immigrants from North Macedonia (64.7%, a difference of 0.070%), and Immigrants from Cameroon (64.7%, a difference of 0.070%).
| Demographics | Rating | Rank | Family Households |
| Immigrants | China | 86.6 /100 | #136 | Excellent 64.7% |
| Immigrants | Scotland | 86.4 /100 | #137 | Excellent 64.7% |
| Basques | 85.5 /100 | #138 | Excellent 64.7% |
| Immigrants | Jamaica | 85.3 /100 | #139 | Excellent 64.7% |
| Immigrants | North Macedonia | 84.9 /100 | #140 | Excellent 64.7% |
| Immigrants | Cameroon | 84.8 /100 | #141 | Excellent 64.7% |
| Pakistanis | 84.0 /100 | #142 | Excellent 64.7% |
| Czechoslovakians | 82.1 /100 | #143 | Excellent 64.6% |
| South American Indians | 81.9 /100 | #144 | Excellent 64.6% |
| Welsh | 80.1 /100 | #145 | Excellent 64.6% |
| Immigrants | Romania | 77.0 /100 | #146 | Good 64.6% |
| Immigrants | Chile | 76.5 /100 | #147 | Good 64.6% |
| Delaware | 76.3 /100 | #148 | Good 64.6% |
| Sioux | 76.3 /100 | #149 | Good 64.6% |
| Romanians | 75.3 /100 | #150 | Good 64.5% |