Burmese vs Tlingit-Haida Family Households
COMPARE
Burmese
Tlingit-Haida
Family Households
Family Households Comparison
Burmese
Tlingit-Haida
65.7%
FAMILY HOUSEHOLDS
99.9/ 100
METRIC RATING
74th/ 347
METRIC RANK
61.6%
FAMILY HOUSEHOLDS
0.0/ 100
METRIC RATING
323rd/ 347
METRIC RANK
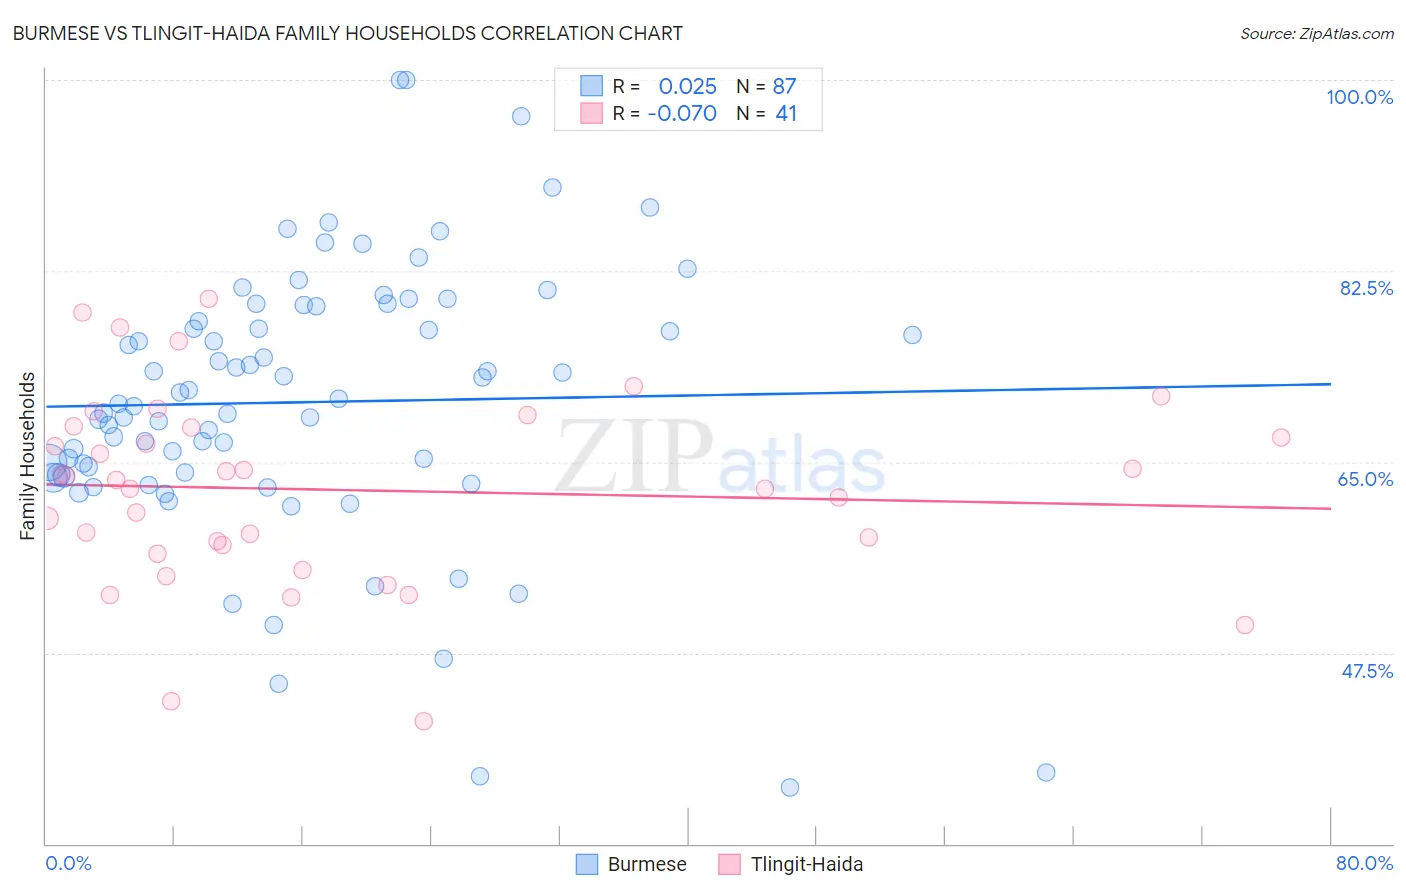
Burmese vs Tlingit-Haida Family Households Correlation Chart
The statistical analysis conducted on geographies consisting of 464,897,249 people shows no correlation between the proportion of Burmese and percentage of family households in the United States with a correlation coefficient (R) of 0.025 and weighted average of 65.7%. Similarly, the statistical analysis conducted on geographies consisting of 60,855,548 people shows a slight negative correlation between the proportion of Tlingit-Haida and percentage of family households in the United States with a correlation coefficient (R) of -0.070 and weighted average of 61.6%, a difference of 6.7%.
Family Households Correlation Summary
| Measurement | Burmese | Tlingit-Haida |
| Minimum | 35.2% | 41.2% |
| Maximum | 100.0% | 80.0% |
| Range | 64.8% | 38.8% |
| Mean | 70.5% | 62.4% |
| Median | 70.3% | 63.4% |
| Interquartile 25% (IQ1) | 63.8% | 57.0% |
| Interquartile 75% (IQ3) | 79.2% | 68.2% |
| Interquartile Range (IQR) | 15.4% | 11.2% |
| Standard Deviation (Sample) | 12.5% | 8.7% |
| Standard Deviation (Population) | 12.5% | 8.6% |
Similar Demographics by Family Households
Demographics Similar to Burmese by Family Households
In terms of family households, the demographic groups most similar to Burmese are Laotian (65.8%, a difference of 0.040%), Houma (65.7%, a difference of 0.050%), Portuguese (65.8%, a difference of 0.11%), Bhutanese (65.9%, a difference of 0.16%), and Immigrants from the Azores (65.6%, a difference of 0.17%).
| Demographics | Rating | Rank | Family Households |
| Filipinos | 99.9 /100 | #67 | Exceptional 65.9% |
| Japanese | 99.9 /100 | #68 | Exceptional 65.9% |
| Malaysians | 99.9 /100 | #69 | Exceptional 65.9% |
| Immigrants | Afghanistan | 99.9 /100 | #70 | Exceptional 65.9% |
| Bhutanese | 99.9 /100 | #71 | Exceptional 65.9% |
| Portuguese | 99.9 /100 | #72 | Exceptional 65.8% |
| Laotians | 99.9 /100 | #73 | Exceptional 65.8% |
| Burmese | 99.9 /100 | #74 | Exceptional 65.7% |
| Houma | 99.9 /100 | #75 | Exceptional 65.7% |
| Immigrants | Azores | 99.8 /100 | #76 | Exceptional 65.6% |
| Immigrants | South America | 99.8 /100 | #77 | Exceptional 65.6% |
| Yaqui | 99.8 /100 | #78 | Exceptional 65.6% |
| Immigrants | Costa Rica | 99.8 /100 | #79 | Exceptional 65.6% |
| Puget Sound Salish | 99.8 /100 | #80 | Exceptional 65.6% |
| Jordanians | 99.7 /100 | #81 | Exceptional 65.5% |
Demographics Similar to Tlingit-Haida by Family Households
In terms of family households, the demographic groups most similar to Tlingit-Haida are Immigrants from Serbia (61.6%, a difference of 0.010%), Immigrants from West Indies (61.6%, a difference of 0.010%), Immigrants from Switzerland (61.6%, a difference of 0.020%), Alsatian (61.7%, a difference of 0.10%), and Ugandan (61.7%, a difference of 0.15%).
| Demographics | Rating | Rank | Family Households |
| Immigrants | Middle Africa | 0.0 /100 | #316 | Tragic 61.9% |
| Immigrants | Bosnia and Herzegovina | 0.0 /100 | #317 | Tragic 61.9% |
| Alaskan Athabascans | 0.0 /100 | #318 | Tragic 61.8% |
| Cape Verdeans | 0.0 /100 | #319 | Tragic 61.8% |
| Ugandans | 0.0 /100 | #320 | Tragic 61.7% |
| Alsatians | 0.0 /100 | #321 | Tragic 61.7% |
| Immigrants | Serbia | 0.0 /100 | #322 | Tragic 61.6% |
| Tlingit-Haida | 0.0 /100 | #323 | Tragic 61.6% |
| Immigrants | West Indies | 0.0 /100 | #324 | Tragic 61.6% |
| Immigrants | Switzerland | 0.0 /100 | #325 | Tragic 61.6% |
| Indonesians | 0.0 /100 | #326 | Tragic 61.5% |
| Blacks/African Americans | 0.0 /100 | #327 | Tragic 61.5% |
| Kiowa | 0.0 /100 | #328 | Tragic 61.4% |
| Cambodians | 0.0 /100 | #329 | Tragic 61.4% |
| Immigrants | Australia | 0.0 /100 | #330 | Tragic 61.3% |