Burmese vs Czechoslovakian Male Unemployment
COMPARE
Burmese
Czechoslovakian
Male Unemployment
Male Unemployment Comparison
Burmese
Czechoslovakians
4.9%
MALE UNEMPLOYMENT
99.3/ 100
METRIC RATING
39th/ 347
METRIC RANK
5.0%
MALE UNEMPLOYMENT
98.7/ 100
METRIC RATING
55th/ 347
METRIC RANK
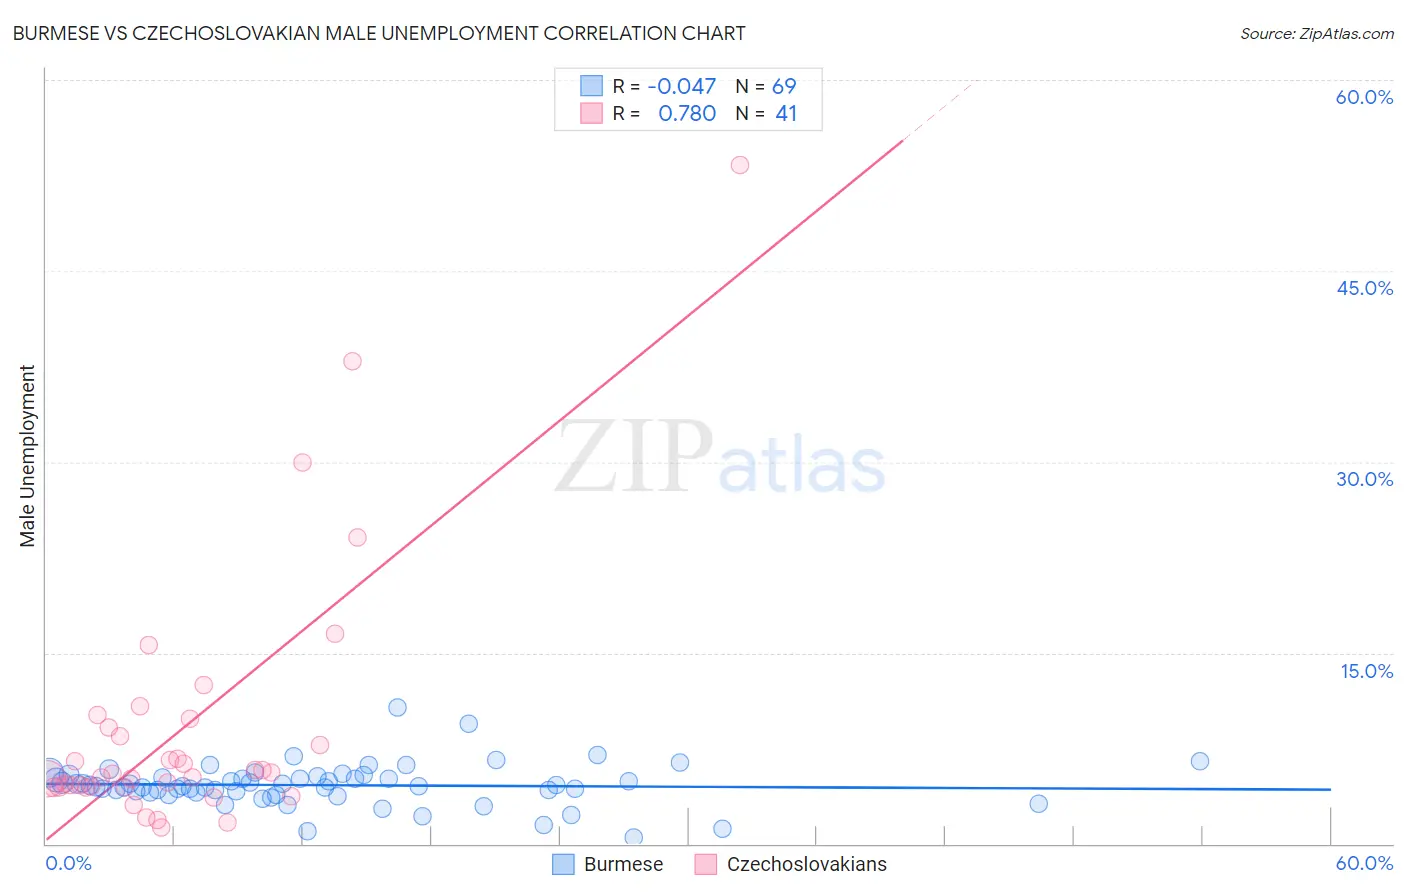
Burmese vs Czechoslovakian Male Unemployment Correlation Chart
The statistical analysis conducted on geographies consisting of 462,600,368 people shows no correlation between the proportion of Burmese and unemployment rate among males in the United States with a correlation coefficient (R) of -0.047 and weighted average of 4.9%. Similarly, the statistical analysis conducted on geographies consisting of 366,692,431 people shows a strong positive correlation between the proportion of Czechoslovakians and unemployment rate among males in the United States with a correlation coefficient (R) of 0.780 and weighted average of 5.0%, a difference of 1.1%.
Male Unemployment Correlation Summary
| Measurement | Burmese | Czechoslovakian |
| Minimum | 0.50% | 1.3% |
| Maximum | 10.7% | 53.3% |
| Range | 10.2% | 52.0% |
| Mean | 4.6% | 9.1% |
| Median | 4.5% | 5.5% |
| Interquartile 25% (IQ1) | 4.0% | 4.5% |
| Interquartile 75% (IQ3) | 5.3% | 9.5% |
| Interquartile Range (IQR) | 1.2% | 5.1% |
| Standard Deviation (Sample) | 1.6% | 10.2% |
| Standard Deviation (Population) | 1.6% | 10.1% |
Demographics Similar to Burmese and Czechoslovakians by Male Unemployment
In terms of male unemployment, the demographic groups most similar to Burmese are Immigrants from Bosnia and Herzegovina (4.9%, a difference of 0.070%), Northern European (4.9%, a difference of 0.080%), Scotch-Irish (4.9%, a difference of 0.090%), Chinese (4.9%, a difference of 0.17%), and Immigrants from Belgium (4.9%, a difference of 0.19%). Similarly, the demographic groups most similar to Czechoslovakians are Yugoslavian (5.0%, a difference of 0.0%), Immigrants from Bulgaria (5.0%, a difference of 0.0%), Jordanian (5.0%, a difference of 0.11%), Irish (5.0%, a difference of 0.17%), and Slovene (5.0%, a difference of 0.19%).
| Demographics | Rating | Rank | Male Unemployment |
| Scotch-Irish | 99.4 /100 | #37 | Exceptional 4.9% |
| Immigrants | Bosnia and Herzegovina | 99.4 /100 | #38 | Exceptional 4.9% |
| Burmese | 99.3 /100 | #39 | Exceptional 4.9% |
| Northern Europeans | 99.3 /100 | #40 | Exceptional 4.9% |
| Chinese | 99.3 /100 | #41 | Exceptional 4.9% |
| Immigrants | Belgium | 99.2 /100 | #42 | Exceptional 4.9% |
| Immigrants | Japan | 99.2 /100 | #43 | Exceptional 4.9% |
| Immigrants | Korea | 99.1 /100 | #44 | Exceptional 4.9% |
| Immigrants | Zimbabwe | 99.0 /100 | #45 | Exceptional 4.9% |
| Bhutanese | 98.9 /100 | #46 | Exceptional 4.9% |
| Austrians | 98.9 /100 | #47 | Exceptional 4.9% |
| Immigrants | Scotland | 98.9 /100 | #48 | Exceptional 4.9% |
| Poles | 98.9 /100 | #49 | Exceptional 4.9% |
| Croatians | 98.9 /100 | #50 | Exceptional 4.9% |
| Slovenes | 98.8 /100 | #51 | Exceptional 5.0% |
| Irish | 98.8 /100 | #52 | Exceptional 5.0% |
| Jordanians | 98.8 /100 | #53 | Exceptional 5.0% |
| Yugoslavians | 98.7 /100 | #54 | Exceptional 5.0% |
| Czechoslovakians | 98.7 /100 | #55 | Exceptional 5.0% |
| Immigrants | Bulgaria | 98.7 /100 | #56 | Exceptional 5.0% |
| Turks | 98.5 /100 | #57 | Exceptional 5.0% |