Immigrants from Eastern Africa vs Czechoslovakian Family Households
COMPARE
Immigrants from Eastern Africa
Czechoslovakian
Family Households
Family Households Comparison
Immigrants from Eastern Africa
Czechoslovakians
61.1%
FAMILY HOUSEHOLDS
0.0/ 100
METRIC RATING
334th/ 347
METRIC RANK
64.6%
FAMILY HOUSEHOLDS
82.1/ 100
METRIC RATING
143rd/ 347
METRIC RANK
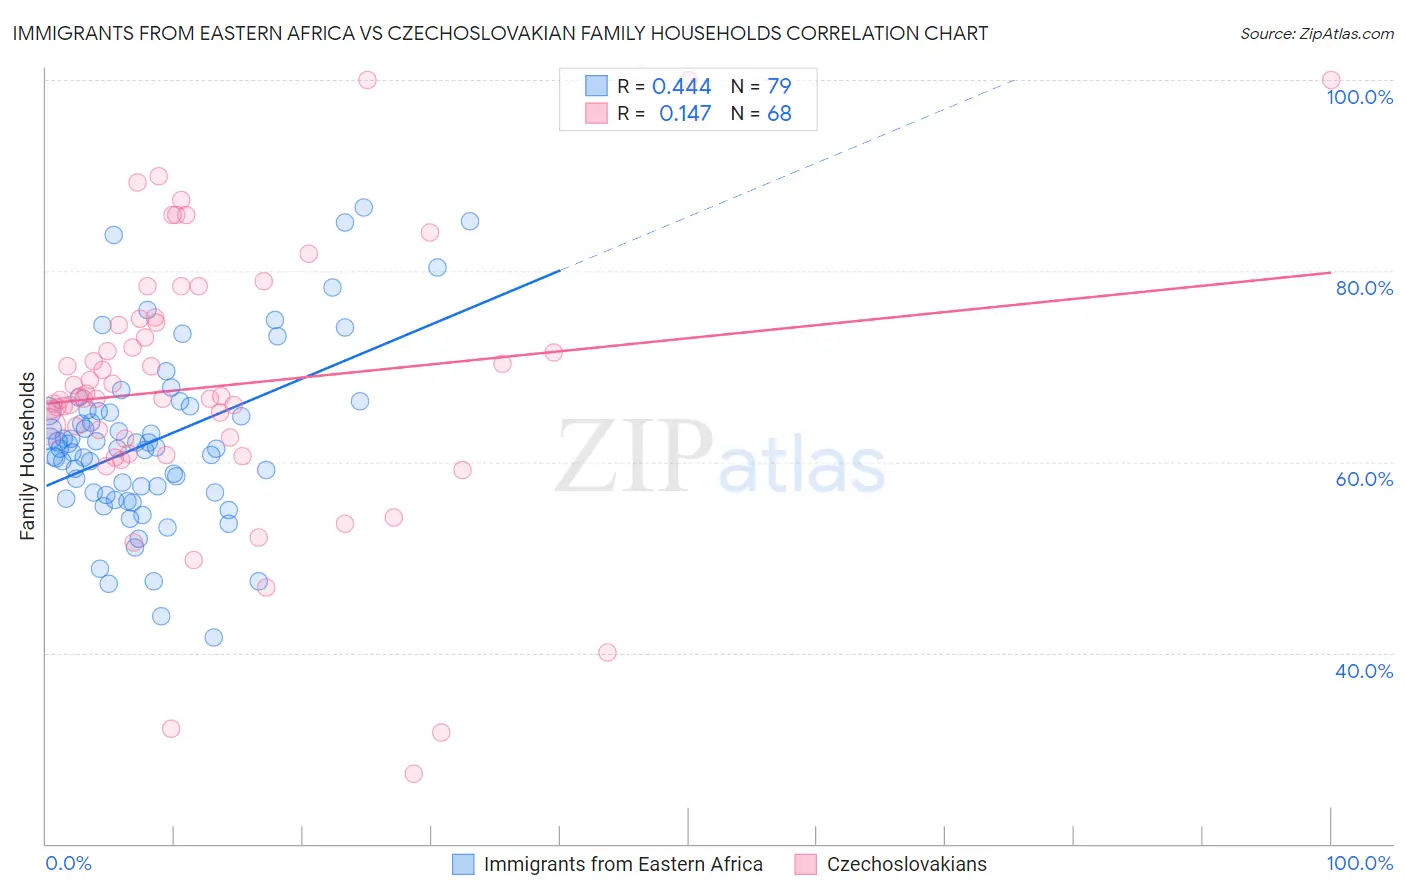
Immigrants from Eastern Africa vs Czechoslovakian Family Households Correlation Chart
The statistical analysis conducted on geographies consisting of 354,874,836 people shows a moderate positive correlation between the proportion of Immigrants from Eastern Africa and percentage of family households in the United States with a correlation coefficient (R) of 0.444 and weighted average of 61.1%. Similarly, the statistical analysis conducted on geographies consisting of 368,525,502 people shows a poor positive correlation between the proportion of Czechoslovakians and percentage of family households in the United States with a correlation coefficient (R) of 0.147 and weighted average of 64.6%, a difference of 5.7%.
Family Households Correlation Summary
| Measurement | Immigrants from Eastern Africa | Czechoslovakian |
| Minimum | 41.7% | 27.4% |
| Maximum | 86.7% | 100.0% |
| Range | 45.0% | 72.6% |
| Mean | 62.2% | 67.9% |
| Median | 61.4% | 66.7% |
| Interquartile 25% (IQ1) | 56.8% | 61.6% |
| Interquartile 75% (IQ3) | 65.4% | 74.8% |
| Interquartile Range (IQR) | 8.6% | 13.1% |
| Standard Deviation (Sample) | 9.1% | 14.4% |
| Standard Deviation (Population) | 9.0% | 14.3% |
Similar Demographics by Family Households
Demographics Similar to Immigrants from Eastern Africa by Family Households
In terms of family households, the demographic groups most similar to Immigrants from Eastern Africa are Immigrants from Ethiopia (61.2%, a difference of 0.080%), Carpatho Rusyn (61.1%, a difference of 0.12%), Ethiopian (61.2%, a difference of 0.16%), Immigrants from Australia (61.3%, a difference of 0.24%), and Immigrants from France (61.3%, a difference of 0.24%).
| Demographics | Rating | Rank | Family Households |
| Blacks/African Americans | 0.0 /100 | #327 | Tragic 61.5% |
| Kiowa | 0.0 /100 | #328 | Tragic 61.4% |
| Cambodians | 0.0 /100 | #329 | Tragic 61.4% |
| Immigrants | Australia | 0.0 /100 | #330 | Tragic 61.3% |
| Immigrants | France | 0.0 /100 | #331 | Tragic 61.3% |
| Ethiopians | 0.0 /100 | #332 | Tragic 61.2% |
| Immigrants | Ethiopia | 0.0 /100 | #333 | Tragic 61.2% |
| Immigrants | Eastern Africa | 0.0 /100 | #334 | Tragic 61.1% |
| Carpatho Rusyns | 0.0 /100 | #335 | Tragic 61.1% |
| German Russians | 0.0 /100 | #336 | Tragic 60.9% |
| Soviet Union | 0.0 /100 | #337 | Tragic 60.9% |
| Immigrants | Eritrea | 0.0 /100 | #338 | Tragic 60.8% |
| Immigrants | Saudi Arabia | 0.0 /100 | #339 | Tragic 60.7% |
| Immigrants | Sudan | 0.0 /100 | #340 | Tragic 60.2% |
| Immigrants | Senegal | 0.0 /100 | #341 | Tragic 60.1% |
Demographics Similar to Czechoslovakians by Family Households
In terms of family households, the demographic groups most similar to Czechoslovakians are South American Indian (64.6%, a difference of 0.0%), Welsh (64.6%, a difference of 0.040%), Pakistani (64.7%, a difference of 0.050%), Immigrants from North Macedonia (64.7%, a difference of 0.070%), and Immigrants from Cameroon (64.7%, a difference of 0.070%).
| Demographics | Rating | Rank | Family Households |
| Immigrants | China | 86.6 /100 | #136 | Excellent 64.7% |
| Immigrants | Scotland | 86.4 /100 | #137 | Excellent 64.7% |
| Basques | 85.5 /100 | #138 | Excellent 64.7% |
| Immigrants | Jamaica | 85.3 /100 | #139 | Excellent 64.7% |
| Immigrants | North Macedonia | 84.9 /100 | #140 | Excellent 64.7% |
| Immigrants | Cameroon | 84.8 /100 | #141 | Excellent 64.7% |
| Pakistanis | 84.0 /100 | #142 | Excellent 64.7% |
| Czechoslovakians | 82.1 /100 | #143 | Excellent 64.6% |
| South American Indians | 81.9 /100 | #144 | Excellent 64.6% |
| Welsh | 80.1 /100 | #145 | Excellent 64.6% |
| Immigrants | Romania | 77.0 /100 | #146 | Good 64.6% |
| Immigrants | Chile | 76.5 /100 | #147 | Good 64.6% |
| Delaware | 76.3 /100 | #148 | Good 64.6% |
| Sioux | 76.3 /100 | #149 | Good 64.6% |
| Romanians | 75.3 /100 | #150 | Good 64.5% |