Bulgarian vs Immigrants from Hong Kong Female Unemployment
COMPARE
Bulgarian
Immigrants from Hong Kong
Female Unemployment
Female Unemployment Comparison
Bulgarians
Immigrants from Hong Kong
4.7%
FEMALE UNEMPLOYMENT
99.9/ 100
METRIC RATING
20th/ 347
METRIC RANK
5.1%
FEMALE UNEMPLOYMENT
84.8/ 100
METRIC RATING
133rd/ 347
METRIC RANK
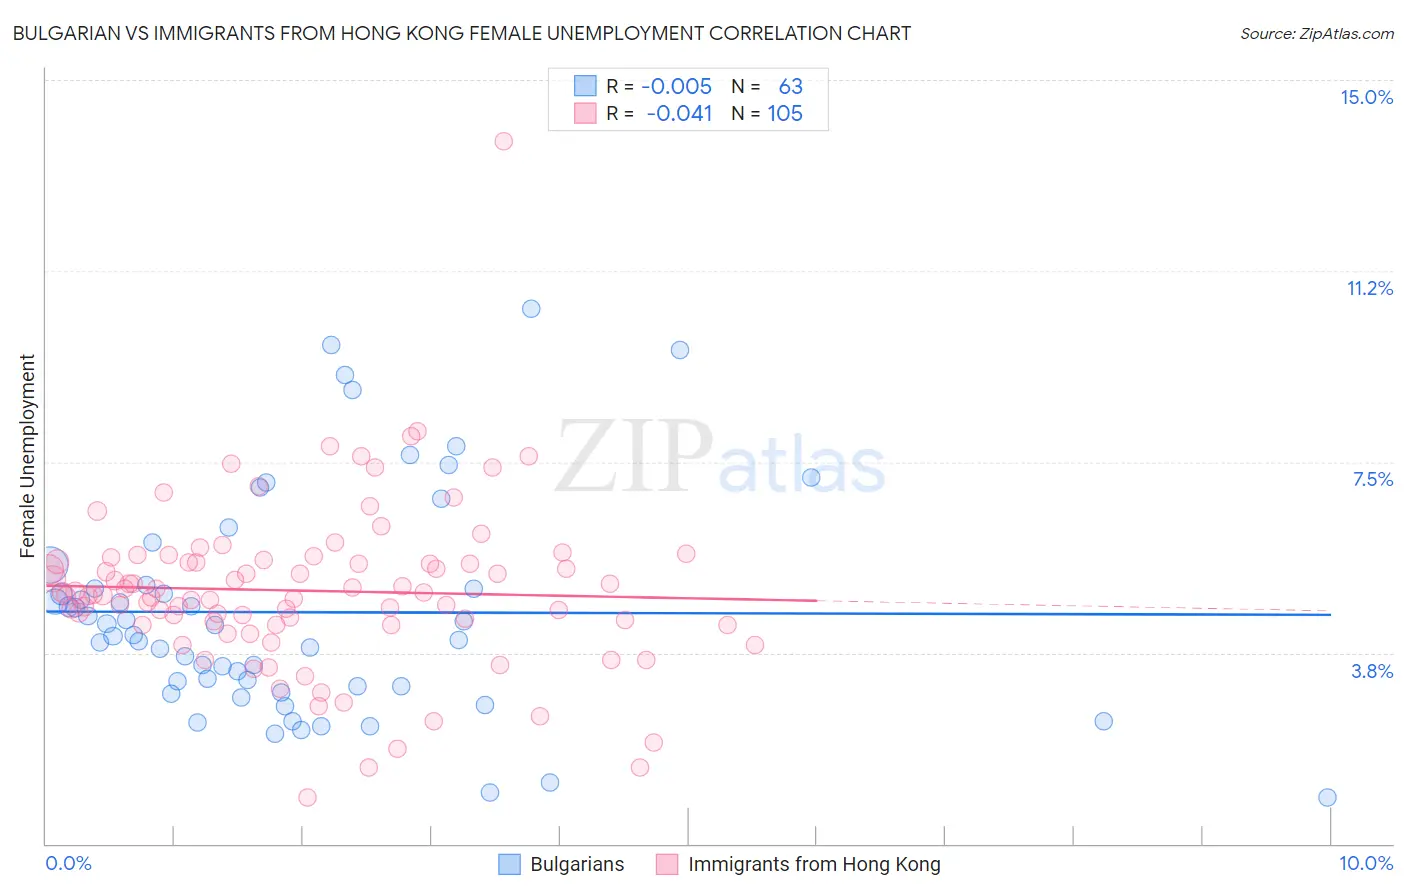
Bulgarian vs Immigrants from Hong Kong Female Unemployment Correlation Chart
The statistical analysis conducted on geographies consisting of 205,222,328 people shows no correlation between the proportion of Bulgarians and unemploymnet rate among females in the United States with a correlation coefficient (R) of -0.005 and weighted average of 4.7%. Similarly, the statistical analysis conducted on geographies consisting of 253,623,871 people shows no correlation between the proportion of Immigrants from Hong Kong and unemploymnet rate among females in the United States with a correlation coefficient (R) of -0.041 and weighted average of 5.1%, a difference of 9.3%.
Female Unemployment Correlation Summary
| Measurement | Bulgarian | Immigrants from Hong Kong |
| Minimum | 0.90% | 0.90% |
| Maximum | 10.5% | 13.8% |
| Range | 9.6% | 12.9% |
| Mean | 4.5% | 5.0% |
| Median | 4.1% | 4.9% |
| Interquartile 25% (IQ1) | 3.1% | 4.3% |
| Interquartile 75% (IQ3) | 5.1% | 5.6% |
| Interquartile Range (IQR) | 2.0% | 1.3% |
| Standard Deviation (Sample) | 2.2% | 1.6% |
| Standard Deviation (Population) | 2.2% | 1.6% |
Similar Demographics by Female Unemployment
Demographics Similar to Bulgarians by Female Unemployment
In terms of female unemployment, the demographic groups most similar to Bulgarians are Fijian (4.7%, a difference of 0.010%), European (4.7%, a difference of 0.030%), Polish (4.7%, a difference of 0.080%), Latvian (4.7%, a difference of 0.090%), and Croatian (4.7%, a difference of 0.24%).
| Demographics | Rating | Rank | Female Unemployment |
| Belgians | 100.0 /100 | #13 | Exceptional 4.6% |
| Finns | 100.0 /100 | #14 | Exceptional 4.6% |
| English | 100.0 /100 | #15 | Exceptional 4.6% |
| Carpatho Rusyns | 99.9 /100 | #16 | Exceptional 4.7% |
| Croatians | 99.9 /100 | #17 | Exceptional 4.7% |
| Latvians | 99.9 /100 | #18 | Exceptional 4.7% |
| Poles | 99.9 /100 | #19 | Exceptional 4.7% |
| Bulgarians | 99.9 /100 | #20 | Exceptional 4.7% |
| Fijians | 99.9 /100 | #21 | Exceptional 4.7% |
| Europeans | 99.9 /100 | #22 | Exceptional 4.7% |
| Scottish | 99.9 /100 | #23 | Exceptional 4.7% |
| Welsh | 99.9 /100 | #24 | Exceptional 4.7% |
| Immigrants | India | 99.9 /100 | #25 | Exceptional 4.7% |
| Immigrants | Bosnia and Herzegovina | 99.9 /100 | #26 | Exceptional 4.7% |
| British | 99.9 /100 | #27 | Exceptional 4.7% |
Demographics Similar to Immigrants from Hong Kong by Female Unemployment
In terms of female unemployment, the demographic groups most similar to Immigrants from Hong Kong are Immigrants from Sri Lanka (5.1%, a difference of 0.020%), Immigrants from Eritrea (5.1%, a difference of 0.020%), Immigrants from Latvia (5.1%, a difference of 0.030%), Immigrants from Ethiopia (5.1%, a difference of 0.070%), and Indian (Asian) (5.1%, a difference of 0.070%).
| Demographics | Rating | Rank | Female Unemployment |
| Immigrants | Korea | 86.3 /100 | #126 | Excellent 5.1% |
| Immigrants | Hungary | 86.0 /100 | #127 | Excellent 5.1% |
| Chileans | 85.8 /100 | #128 | Excellent 5.1% |
| Ethiopians | 85.7 /100 | #129 | Excellent 5.1% |
| Maltese | 85.5 /100 | #130 | Excellent 5.1% |
| Immigrants | Ethiopia | 85.4 /100 | #131 | Excellent 5.1% |
| Immigrants | Sri Lanka | 85.0 /100 | #132 | Excellent 5.1% |
| Immigrants | Hong Kong | 84.8 /100 | #133 | Excellent 5.1% |
| Immigrants | Eritrea | 84.6 /100 | #134 | Excellent 5.1% |
| Immigrants | Latvia | 84.6 /100 | #135 | Excellent 5.1% |
| Indians (Asian) | 84.2 /100 | #136 | Excellent 5.1% |
| Pakistanis | 83.8 /100 | #137 | Excellent 5.1% |
| Chickasaw | 83.2 /100 | #138 | Excellent 5.1% |
| Immigrants | Eastern Asia | 83.0 /100 | #139 | Excellent 5.1% |
| Immigrants | France | 82.7 /100 | #140 | Excellent 5.1% |