Immigrants from Bulgaria vs Thai Single Father Households
COMPARE
Immigrants from Bulgaria
Thai
Single Father Households
Single Father Households Comparison
Immigrants from Bulgaria
Thais
2.0%
SINGLE FATHER HOUSEHOLDS
100.0/ 100
METRIC RATING
40th/ 347
METRIC RANK
1.9%
SINGLE FATHER HOUSEHOLDS
100.0/ 100
METRIC RATING
20th/ 347
METRIC RANK
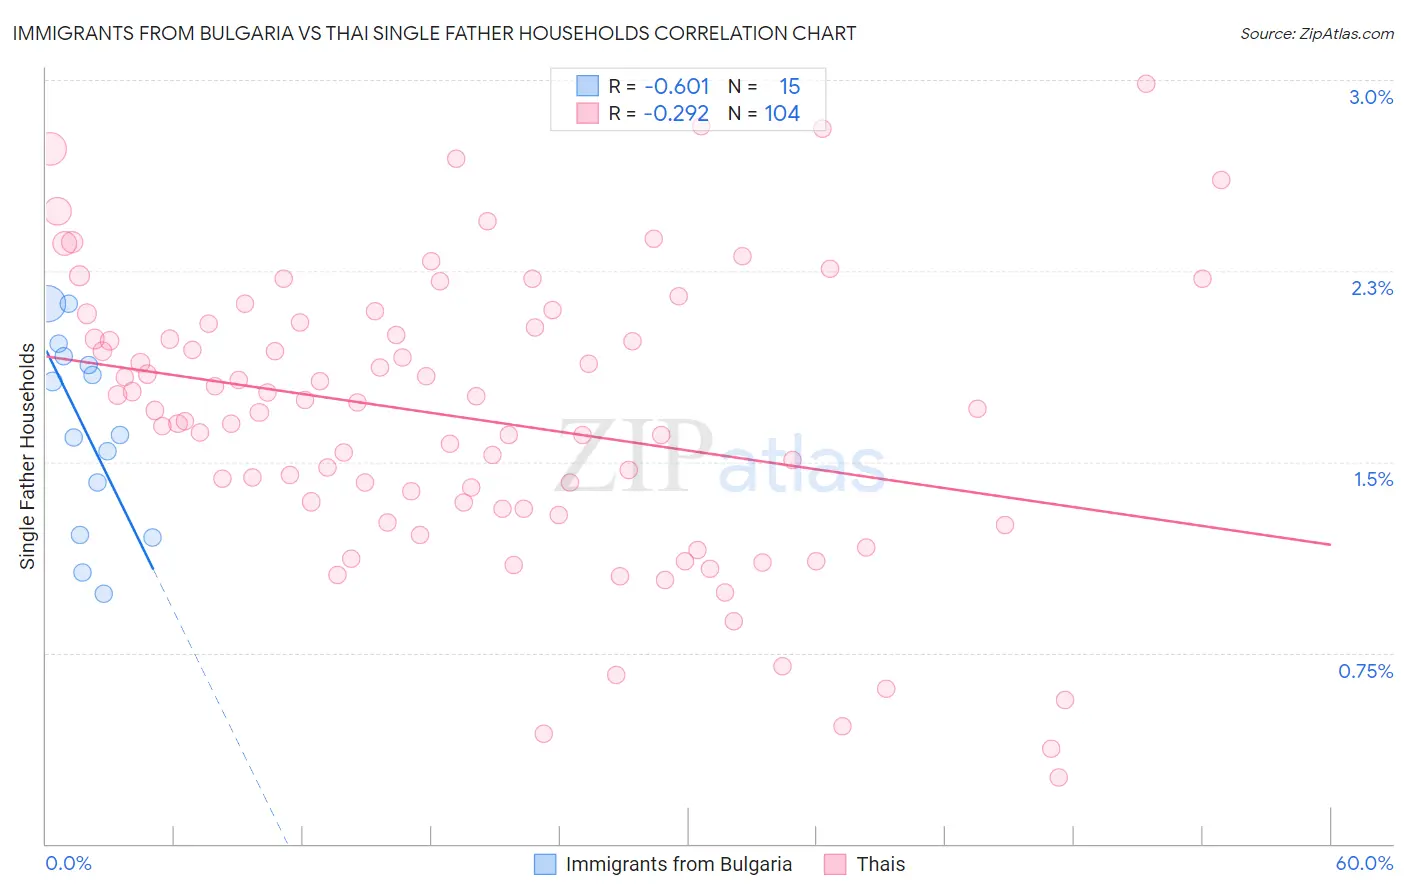
Immigrants from Bulgaria vs Thai Single Father Households Correlation Chart
The statistical analysis conducted on geographies consisting of 172,048,357 people shows a significant negative correlation between the proportion of Immigrants from Bulgaria and percentage of single father households in the United States with a correlation coefficient (R) of -0.601 and weighted average of 2.0%. Similarly, the statistical analysis conducted on geographies consisting of 470,214,576 people shows a weak negative correlation between the proportion of Thais and percentage of single father households in the United States with a correlation coefficient (R) of -0.292 and weighted average of 1.9%, a difference of 3.6%.
Single Father Households Correlation Summary
| Measurement | Immigrants from Bulgaria | Thai |
| Minimum | 0.98% | 0.26% |
| Maximum | 2.1% | 3.0% |
| Range | 1.1% | 2.7% |
| Mean | 1.6% | 1.7% |
| Median | 1.6% | 1.7% |
| Interquartile 25% (IQ1) | 1.2% | 1.3% |
| Interquartile 75% (IQ3) | 1.9% | 2.0% |
| Interquartile Range (IQR) | 0.70% | 0.72% |
| Standard Deviation (Sample) | 0.37% | 0.56% |
| Standard Deviation (Population) | 0.36% | 0.56% |
Demographics Similar to Immigrants from Bulgaria and Thais by Single Father Households
In terms of single father households, the demographic groups most similar to Immigrants from Bulgaria are Immigrants from Eastern Europe (2.0%, a difference of 0.050%), Immigrants from Sri Lanka (2.0%, a difference of 0.050%), Immigrants from St. Vincent and the Grenadines (2.0%, a difference of 0.35%), Immigrants from Belgium (2.0%, a difference of 0.37%), and Albanian (2.0%, a difference of 0.48%). Similarly, the demographic groups most similar to Thais are Immigrants from Albania (1.9%, a difference of 0.30%), Immigrants from Latvia (1.9%, a difference of 0.49%), Immigrants from Croatia (2.0%, a difference of 1.7%), Immigrants from Russia (2.0%, a difference of 1.7%), and Eastern European (2.0%, a difference of 1.7%).
| Demographics | Rating | Rank | Single Father Households |
| Thais | 100.0 /100 | #20 | Exceptional 1.9% |
| Immigrants | Albania | 100.0 /100 | #21 | Exceptional 1.9% |
| Immigrants | Latvia | 100.0 /100 | #22 | Exceptional 1.9% |
| Immigrants | Croatia | 100.0 /100 | #23 | Exceptional 2.0% |
| Immigrants | Russia | 100.0 /100 | #24 | Exceptional 2.0% |
| Eastern Europeans | 100.0 /100 | #25 | Exceptional 2.0% |
| Assyrians/Chaldeans/Syriacs | 100.0 /100 | #26 | Exceptional 2.0% |
| Immigrants | South Central Asia | 100.0 /100 | #27 | Exceptional 2.0% |
| Immigrants | Japan | 100.0 /100 | #28 | Exceptional 2.0% |
| Bulgarians | 100.0 /100 | #29 | Exceptional 2.0% |
| Cambodians | 100.0 /100 | #30 | Exceptional 2.0% |
| Israelis | 100.0 /100 | #31 | Exceptional 2.0% |
| Chinese | 100.0 /100 | #32 | Exceptional 2.0% |
| Turks | 100.0 /100 | #33 | Exceptional 2.0% |
| Immigrants | Australia | 100.0 /100 | #34 | Exceptional 2.0% |
| Albanians | 100.0 /100 | #35 | Exceptional 2.0% |
| Immigrants | Belgium | 100.0 /100 | #36 | Exceptional 2.0% |
| Immigrants | St. Vincent and the Grenadines | 100.0 /100 | #37 | Exceptional 2.0% |
| Immigrants | Eastern Europe | 100.0 /100 | #38 | Exceptional 2.0% |
| Immigrants | Sri Lanka | 100.0 /100 | #39 | Exceptional 2.0% |
| Immigrants | Bulgaria | 100.0 /100 | #40 | Exceptional 2.0% |