British vs Thai Single Father Poverty
COMPARE
British
Thai
Single Father Poverty
Single Father Poverty Comparison
British
Thais
16.8%
SINGLE FATHER POVERTY
5.6/ 100
METRIC RATING
227th/ 347
METRIC RANK
14.5%
SINGLE FATHER POVERTY
100.0/ 100
METRIC RATING
30th/ 347
METRIC RANK
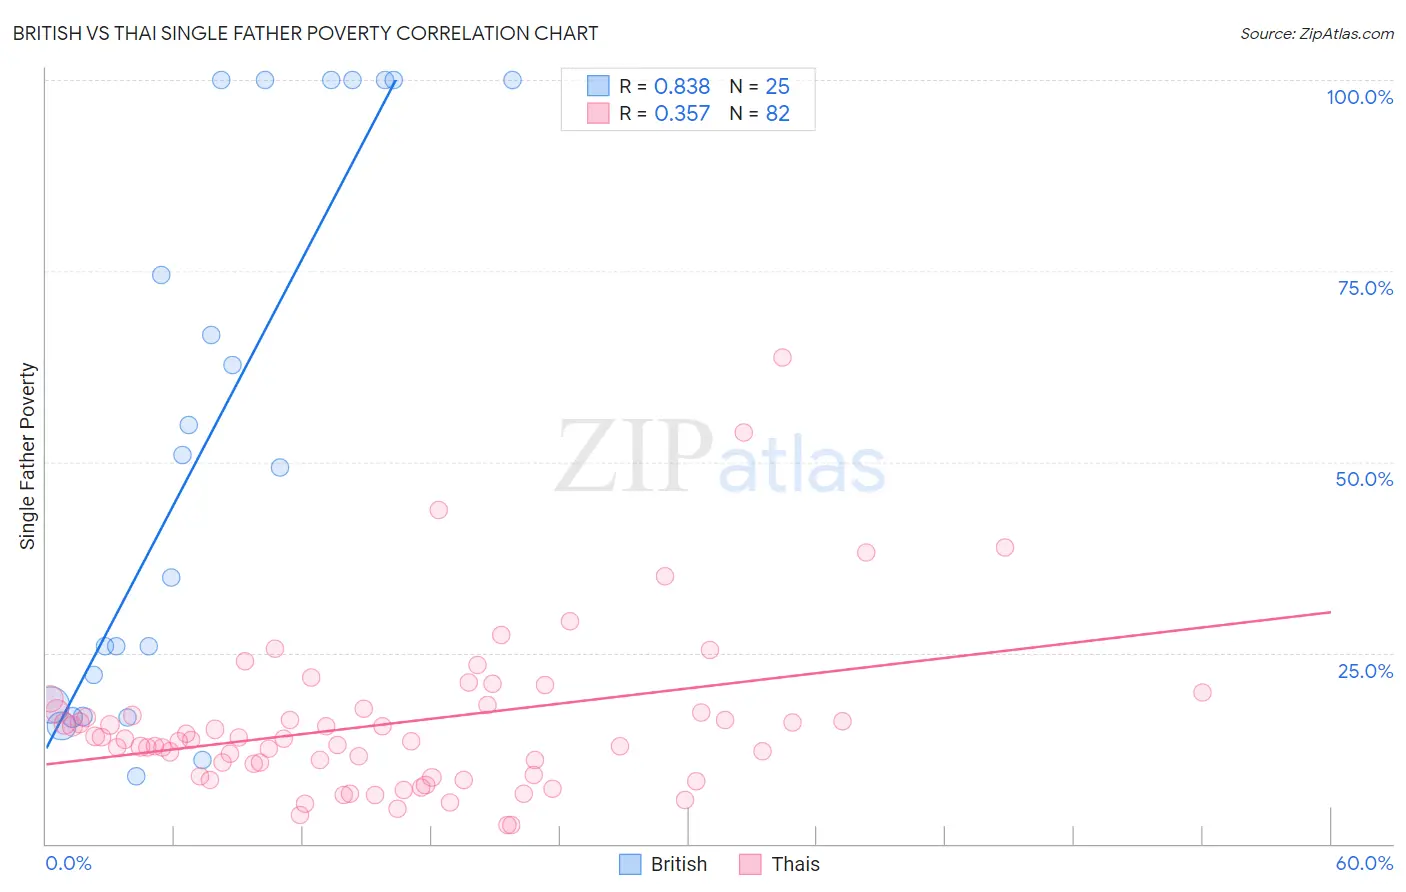
British vs Thai Single Father Poverty Correlation Chart
The statistical analysis conducted on geographies consisting of 389,691,429 people shows a very strong positive correlation between the proportion of British and poverty level among single fathers in the United States with a correlation coefficient (R) of 0.838 and weighted average of 16.8%. Similarly, the statistical analysis conducted on geographies consisting of 363,511,447 people shows a mild positive correlation between the proportion of Thais and poverty level among single fathers in the United States with a correlation coefficient (R) of 0.357 and weighted average of 14.5%, a difference of 15.7%.
Single Father Poverty Correlation Summary
| Measurement | British | Thai |
| Minimum | 8.8% | 2.5% |
| Maximum | 100.0% | 63.6% |
| Range | 91.2% | 61.2% |
| Mean | 51.9% | 15.7% |
| Median | 49.3% | 13.6% |
| Interquartile 25% (IQ1) | 17.4% | 9.0% |
| Interquartile 75% (IQ3) | 100.0% | 17.4% |
| Interquartile Range (IQR) | 82.6% | 8.4% |
| Standard Deviation (Sample) | 35.4% | 10.5% |
| Standard Deviation (Population) | 34.6% | 10.4% |
Similar Demographics by Single Father Poverty
Demographics Similar to British by Single Father Poverty
In terms of single father poverty, the demographic groups most similar to British are Belgian (16.8%, a difference of 0.070%), Hispanic or Latino (16.8%, a difference of 0.10%), Menominee (16.8%, a difference of 0.15%), Immigrants from Norway (16.8%, a difference of 0.16%), and Israeli (16.8%, a difference of 0.22%).
| Demographics | Rating | Rank | Single Father Poverty |
| Immigrants | Denmark | 8.1 /100 | #220 | Tragic 16.7% |
| Immigrants | Greece | 8.1 /100 | #221 | Tragic 16.7% |
| Immigrants | Spain | 8.0 /100 | #222 | Tragic 16.7% |
| Immigrants | Austria | 7.0 /100 | #223 | Tragic 16.8% |
| Immigrants | Norway | 6.5 /100 | #224 | Tragic 16.8% |
| Menominee | 6.4 /100 | #225 | Tragic 16.8% |
| Hispanics or Latinos | 6.1 /100 | #226 | Tragic 16.8% |
| British | 5.6 /100 | #227 | Tragic 16.8% |
| Belgians | 5.3 /100 | #228 | Tragic 16.8% |
| Israelis | 4.6 /100 | #229 | Tragic 16.8% |
| Immigrants | Trinidad and Tobago | 4.5 /100 | #230 | Tragic 16.8% |
| Spanish Americans | 3.7 /100 | #231 | Tragic 16.9% |
| Immigrants | Grenada | 3.7 /100 | #232 | Tragic 16.9% |
| Senegalese | 3.2 /100 | #233 | Tragic 16.9% |
| Marshallese | 3.1 /100 | #234 | Tragic 16.9% |
Demographics Similar to Thais by Single Father Poverty
In terms of single father poverty, the demographic groups most similar to Thais are Somali (14.5%, a difference of 0.040%), Icelander (14.5%, a difference of 0.080%), Immigrants from South Central Asia (14.5%, a difference of 0.15%), Asian (14.6%, a difference of 0.24%), and Nepalese (14.4%, a difference of 0.68%).
| Demographics | Rating | Rank | Single Father Poverty |
| Immigrants | Egypt | 100.0 /100 | #23 | Exceptional 14.4% |
| Immigrants | South Eastern Asia | 100.0 /100 | #24 | Exceptional 14.4% |
| Iranians | 100.0 /100 | #25 | Exceptional 14.4% |
| Spanish American Indians | 100.0 /100 | #26 | Exceptional 14.4% |
| Nepalese | 100.0 /100 | #27 | Exceptional 14.4% |
| Immigrants | South Central Asia | 100.0 /100 | #28 | Exceptional 14.5% |
| Somalis | 100.0 /100 | #29 | Exceptional 14.5% |
| Thais | 100.0 /100 | #30 | Exceptional 14.5% |
| Icelanders | 100.0 /100 | #31 | Exceptional 14.5% |
| Asians | 100.0 /100 | #32 | Exceptional 14.6% |
| Okinawans | 100.0 /100 | #33 | Exceptional 14.6% |
| Egyptians | 100.0 /100 | #34 | Exceptional 14.7% |
| Immigrants | Bolivia | 100.0 /100 | #35 | Exceptional 14.7% |
| Immigrants | Indonesia | 100.0 /100 | #36 | Exceptional 14.7% |
| Immigrants | Eastern Africa | 100.0 /100 | #37 | Exceptional 14.7% |