South American vs Thai Single Father Households
COMPARE
South American
Thai
Single Father Households
Single Father Households Comparison
South Americans
Thais
2.3%
SINGLE FATHER HOUSEHOLDS
64.3/ 100
METRIC RATING
167th/ 347
METRIC RANK
1.9%
SINGLE FATHER HOUSEHOLDS
100.0/ 100
METRIC RATING
20th/ 347
METRIC RANK
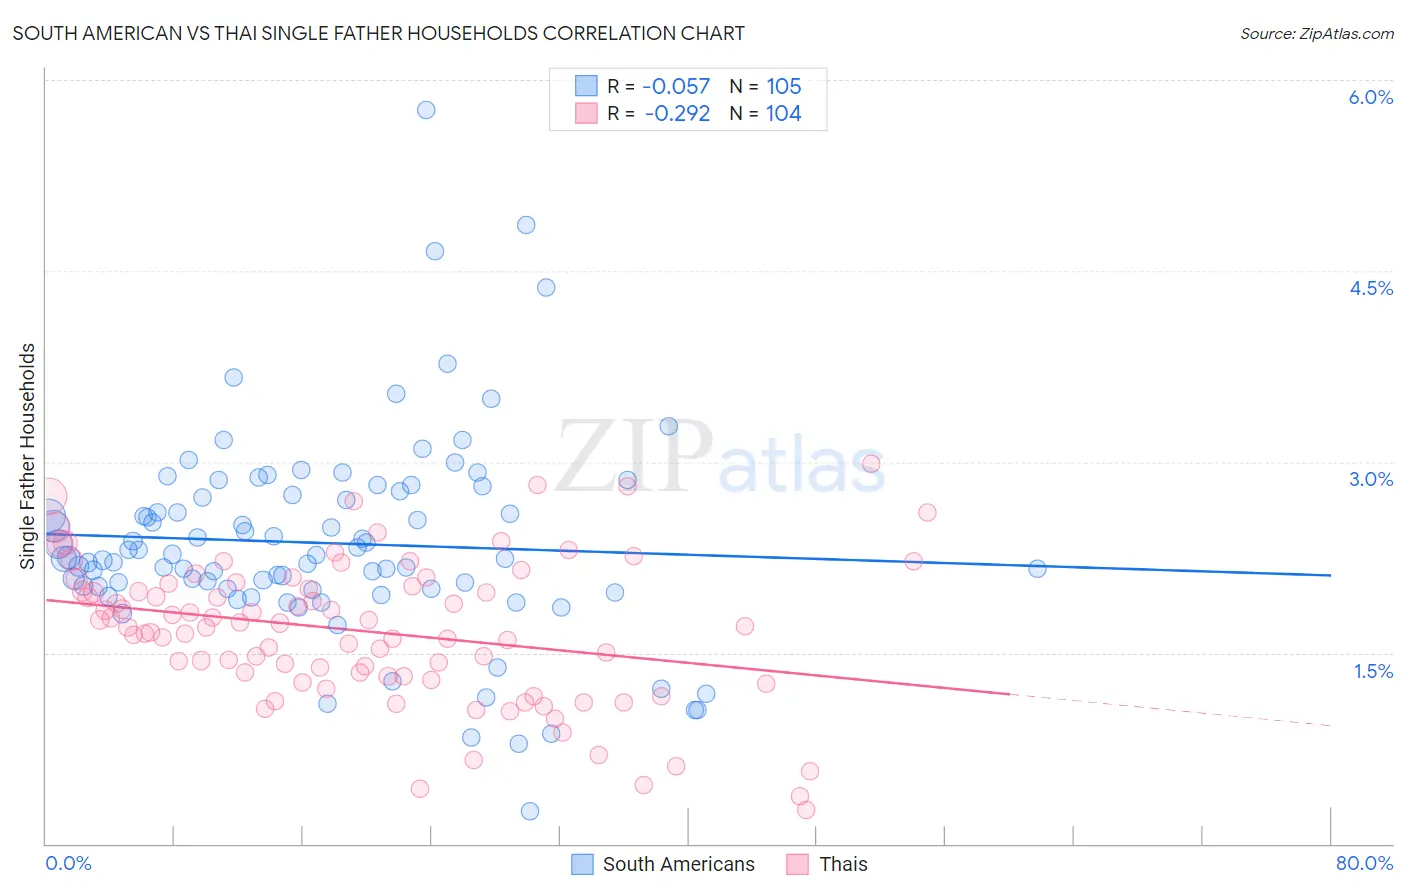
South American vs Thai Single Father Households Correlation Chart
The statistical analysis conducted on geographies consisting of 487,425,874 people shows a slight negative correlation between the proportion of South Americans and percentage of single father households in the United States with a correlation coefficient (R) of -0.057 and weighted average of 2.3%. Similarly, the statistical analysis conducted on geographies consisting of 470,214,576 people shows a weak negative correlation between the proportion of Thais and percentage of single father households in the United States with a correlation coefficient (R) of -0.292 and weighted average of 1.9%, a difference of 20.2%.
Single Father Households Correlation Summary
| Measurement | South American | Thai |
| Minimum | 0.26% | 0.26% |
| Maximum | 5.8% | 3.0% |
| Range | 5.5% | 2.7% |
| Mean | 2.4% | 1.7% |
| Median | 2.3% | 1.7% |
| Interquartile 25% (IQ1) | 2.0% | 1.3% |
| Interquartile 75% (IQ3) | 2.8% | 2.0% |
| Interquartile Range (IQR) | 0.75% | 0.72% |
| Standard Deviation (Sample) | 0.81% | 0.56% |
| Standard Deviation (Population) | 0.81% | 0.56% |
Similar Demographics by Single Father Households
Demographics Similar to South Americans by Single Father Households
In terms of single father households, the demographic groups most similar to South Americans are Icelander (2.3%, a difference of 0.10%), Czech (2.3%, a difference of 0.14%), Ugandan (2.3%, a difference of 0.16%), Swedish (2.3%, a difference of 0.21%), and English (2.3%, a difference of 0.36%).
| Demographics | Rating | Rank | Single Father Households |
| Immigrants | Bolivia | 76.3 /100 | #160 | Good 2.3% |
| Swiss | 73.2 /100 | #161 | Good 2.3% |
| Scottish | 72.8 /100 | #162 | Good 2.3% |
| Irish | 72.1 /100 | #163 | Good 2.3% |
| Pakistanis | 70.6 /100 | #164 | Good 2.3% |
| Scotch-Irish | 69.4 /100 | #165 | Good 2.3% |
| English | 68.6 /100 | #166 | Good 2.3% |
| South Americans | 64.3 /100 | #167 | Good 2.3% |
| Icelanders | 63.1 /100 | #168 | Good 2.3% |
| Czechs | 62.5 /100 | #169 | Good 2.3% |
| Ugandans | 62.2 /100 | #170 | Good 2.3% |
| Swedes | 61.6 /100 | #171 | Good 2.3% |
| Czechoslovakians | 58.9 /100 | #172 | Average 2.3% |
| Celtics | 55.4 /100 | #173 | Average 2.3% |
| Afghans | 50.0 /100 | #174 | Average 2.3% |
Demographics Similar to Thais by Single Father Households
In terms of single father households, the demographic groups most similar to Thais are Iranian (1.9%, a difference of 0.070%), Immigrants from Albania (1.9%, a difference of 0.30%), Immigrants from Latvia (1.9%, a difference of 0.49%), Indian (Asian) (1.9%, a difference of 0.91%), and Immigrants from India (1.9%, a difference of 1.4%).
| Demographics | Rating | Rank | Single Father Households |
| Immigrants | Singapore | 100.0 /100 | #13 | Exceptional 1.9% |
| Immigrants | Lithuania | 100.0 /100 | #14 | Exceptional 1.9% |
| Immigrants | Eastern Asia | 100.0 /100 | #15 | Exceptional 1.9% |
| Immigrants | Iran | 100.0 /100 | #16 | Exceptional 1.9% |
| Immigrants | India | 100.0 /100 | #17 | Exceptional 1.9% |
| Indians (Asian) | 100.0 /100 | #18 | Exceptional 1.9% |
| Iranians | 100.0 /100 | #19 | Exceptional 1.9% |
| Thais | 100.0 /100 | #20 | Exceptional 1.9% |
| Immigrants | Albania | 100.0 /100 | #21 | Exceptional 1.9% |
| Immigrants | Latvia | 100.0 /100 | #22 | Exceptional 1.9% |
| Immigrants | Croatia | 100.0 /100 | #23 | Exceptional 2.0% |
| Immigrants | Russia | 100.0 /100 | #24 | Exceptional 2.0% |
| Eastern Europeans | 100.0 /100 | #25 | Exceptional 2.0% |
| Assyrians/Chaldeans/Syriacs | 100.0 /100 | #26 | Exceptional 2.0% |
| Immigrants | South Central Asia | 100.0 /100 | #27 | Exceptional 2.0% |