British vs Danish Family Households with Children
COMPARE
British
Danish
Family Households with Children
Family Households with Children Comparison
British
Danes
27.4%
FAMILY HOUSEHOLDS WITH CHILDREN
49.9/ 100
METRIC RATING
175th/ 347
METRIC RANK
28.7%
FAMILY HOUSEHOLDS WITH CHILDREN
100.0/ 100
METRIC RATING
57th/ 347
METRIC RANK
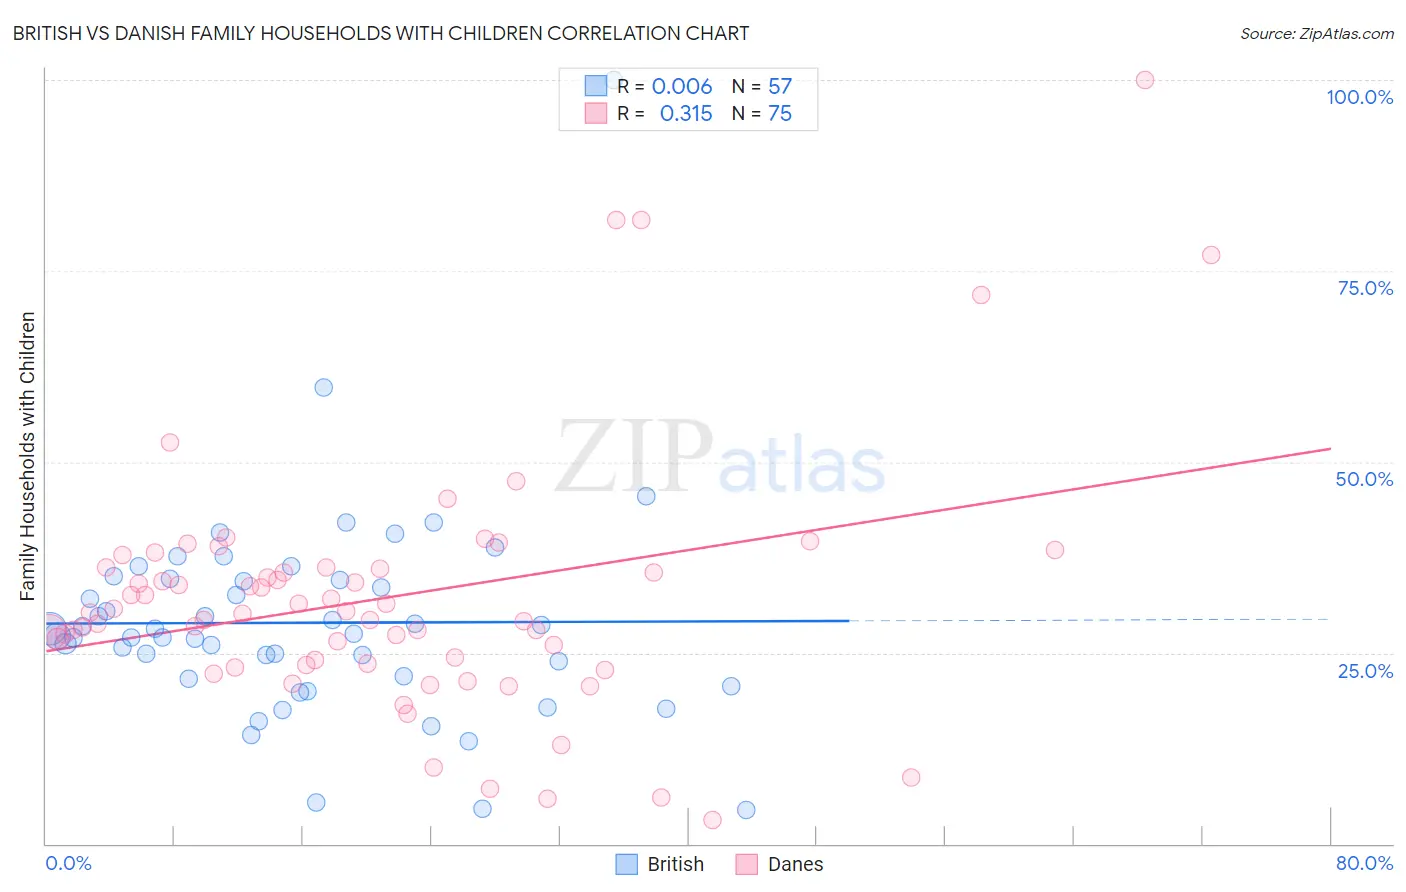
British vs Danish Family Households with Children Correlation Chart
The statistical analysis conducted on geographies consisting of 530,729,097 people shows no correlation between the proportion of British and percentage of family households with children in the United States with a correlation coefficient (R) of 0.006 and weighted average of 27.4%. Similarly, the statistical analysis conducted on geographies consisting of 473,642,797 people shows a mild positive correlation between the proportion of Danes and percentage of family households with children in the United States with a correlation coefficient (R) of 0.315 and weighted average of 28.7%, a difference of 4.7%.
Family Households with Children Correlation Summary
| Measurement | British | Danish |
| Minimum | 4.4% | 3.0% |
| Maximum | 100.0% | 100.0% |
| Range | 95.6% | 97.0% |
| Mean | 28.9% | 32.3% |
| Median | 27.6% | 30.2% |
| Interquartile 25% (IQ1) | 21.8% | 23.6% |
| Interquartile 75% (IQ3) | 34.6% | 36.1% |
| Interquartile Range (IQR) | 12.8% | 12.5% |
| Standard Deviation (Sample) | 13.9% | 16.7% |
| Standard Deviation (Population) | 13.8% | 16.6% |
Similar Demographics by Family Households with Children
Demographics Similar to British by Family Households with Children
In terms of family households with children, the demographic groups most similar to British are White/Caucasian (27.4%, a difference of 0.0%), Immigrants from China (27.4%, a difference of 0.010%), Ugandan (27.4%, a difference of 0.020%), Spanish American (27.4%, a difference of 0.020%), and Immigrants from Argentina (27.5%, a difference of 0.050%).
| Demographics | Rating | Rank | Family Households with Children |
| Immigrants | Kuwait | 60.9 /100 | #168 | Good 27.5% |
| Seminole | 56.9 /100 | #169 | Average 27.5% |
| Cherokee | 56.7 /100 | #170 | Average 27.5% |
| Blackfeet | 54.3 /100 | #171 | Average 27.5% |
| Israelis | 53.9 /100 | #172 | Average 27.5% |
| Immigrants | Argentina | 52.2 /100 | #173 | Average 27.5% |
| Whites/Caucasians | 50.0 /100 | #174 | Average 27.4% |
| British | 49.9 /100 | #175 | Average 27.4% |
| Immigrants | China | 49.6 /100 | #176 | Average 27.4% |
| Ugandans | 49.2 /100 | #177 | Average 27.4% |
| Spanish Americans | 48.9 /100 | #178 | Average 27.4% |
| Turks | 46.9 /100 | #179 | Average 27.4% |
| Immigrants | Turkey | 46.9 /100 | #180 | Average 27.4% |
| Aleuts | 46.7 /100 | #181 | Average 27.4% |
| Puget Sound Salish | 46.2 /100 | #182 | Average 27.4% |
Demographics Similar to Danes by Family Households with Children
In terms of family households with children, the demographic groups most similar to Danes are Hawaiian (28.7%, a difference of 0.15%), Immigrants from Guatemala (28.8%, a difference of 0.24%), Immigrants from Asia (28.8%, a difference of 0.31%), Sierra Leonean (28.9%, a difference of 0.38%), and Immigrants from Cambodia (28.9%, a difference of 0.45%).
| Demographics | Rating | Rank | Family Households with Children |
| Immigrants | Immigrants | 100.0 /100 | #50 | Exceptional 28.9% |
| Immigrants | Peru | 100.0 /100 | #51 | Exceptional 28.9% |
| Guatemalans | 100.0 /100 | #52 | Exceptional 28.9% |
| Immigrants | Cambodia | 100.0 /100 | #53 | Exceptional 28.9% |
| Sierra Leoneans | 100.0 /100 | #54 | Exceptional 28.9% |
| Immigrants | Asia | 100.0 /100 | #55 | Exceptional 28.8% |
| Immigrants | Guatemala | 100.0 /100 | #56 | Exceptional 28.8% |
| Danes | 100.0 /100 | #57 | Exceptional 28.7% |
| Hawaiians | 100.0 /100 | #58 | Exceptional 28.7% |
| Immigrants | Nigeria | 100.0 /100 | #59 | Exceptional 28.6% |
| Hmong | 99.9 /100 | #60 | Exceptional 28.6% |
| Immigrants | Ghana | 99.9 /100 | #61 | Exceptional 28.6% |
| Egyptians | 99.9 /100 | #62 | Exceptional 28.6% |
| Immigrants | Lebanon | 99.9 /100 | #63 | Exceptional 28.6% |
| Filipinos | 99.9 /100 | #64 | Exceptional 28.6% |