British vs New Zealander 4th Grade
COMPARE
British
New Zealander
4th Grade
4th Grade Comparison
British
New Zealanders
98.2%
4TH GRADE
100.0/ 100
METRIC RATING
36th/ 347
METRIC RANK
98.0%
4TH GRADE
99.6/ 100
METRIC RATING
67th/ 347
METRIC RANK
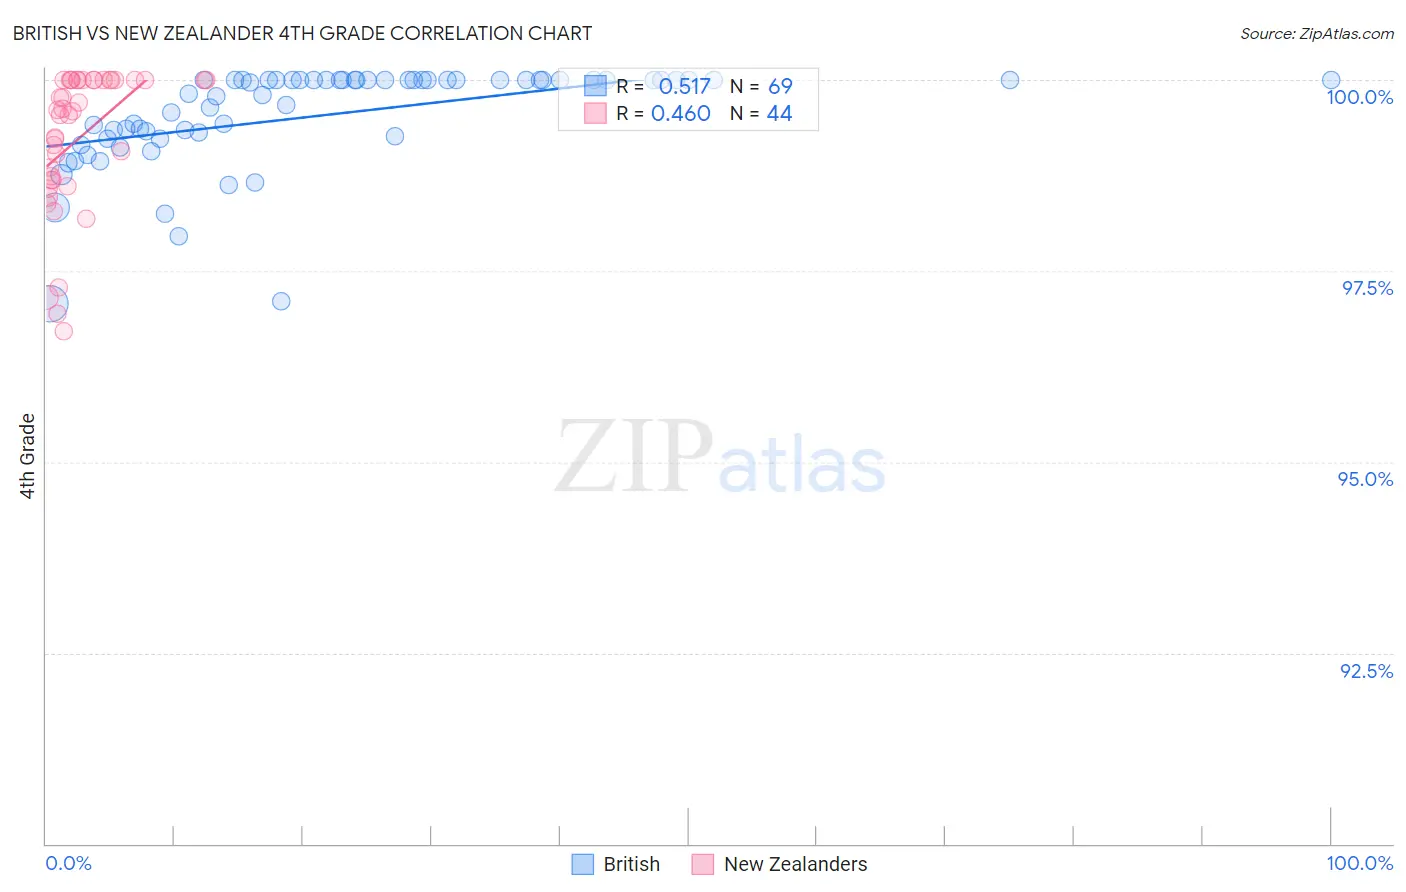
British vs New Zealander 4th Grade Correlation Chart
The statistical analysis conducted on geographies consisting of 531,462,526 people shows a substantial positive correlation between the proportion of British and percentage of population with at least 4th grade education in the United States with a correlation coefficient (R) of 0.517 and weighted average of 98.2%. Similarly, the statistical analysis conducted on geographies consisting of 106,912,544 people shows a moderate positive correlation between the proportion of New Zealanders and percentage of population with at least 4th grade education in the United States with a correlation coefficient (R) of 0.460 and weighted average of 98.0%, a difference of 0.19%.
4th Grade Correlation Summary
| Measurement | British | New Zealander |
| Minimum | 97.1% | 96.7% |
| Maximum | 100.0% | 100.0% |
| Range | 2.9% | 3.3% |
| Mean | 99.5% | 99.2% |
| Median | 100.0% | 99.6% |
| Interquartile 25% (IQ1) | 99.3% | 98.7% |
| Interquartile 75% (IQ3) | 100.0% | 100.0% |
| Interquartile Range (IQR) | 0.75% | 1.3% |
| Standard Deviation (Sample) | 0.67% | 0.92% |
| Standard Deviation (Population) | 0.66% | 0.91% |
Similar Demographics by 4th Grade
Demographics Similar to British by 4th Grade
In terms of 4th grade, the demographic groups most similar to British are Italian (98.2%, a difference of 0.010%), Swiss (98.2%, a difference of 0.020%), Chippewa (98.2%, a difference of 0.020%), Latvian (98.2%, a difference of 0.020%), and Aleut (98.2%, a difference of 0.020%).
| Demographics | Rating | Rank | 4th Grade |
| Czechs | 100.0 /100 | #29 | Exceptional 98.3% |
| Scandinavians | 100.0 /100 | #30 | Exceptional 98.3% |
| Europeans | 100.0 /100 | #31 | Exceptional 98.3% |
| Chinese | 100.0 /100 | #32 | Exceptional 98.3% |
| Swiss | 100.0 /100 | #33 | Exceptional 98.2% |
| Chippewa | 100.0 /100 | #34 | Exceptional 98.2% |
| Italians | 100.0 /100 | #35 | Exceptional 98.2% |
| British | 100.0 /100 | #36 | Exceptional 98.2% |
| Latvians | 99.9 /100 | #37 | Exceptional 98.2% |
| Aleuts | 99.9 /100 | #38 | Exceptional 98.2% |
| Belgians | 99.9 /100 | #39 | Exceptional 98.2% |
| Luxembourgers | 99.9 /100 | #40 | Exceptional 98.2% |
| Eastern Europeans | 99.9 /100 | #41 | Exceptional 98.2% |
| Hungarians | 99.9 /100 | #42 | Exceptional 98.2% |
| Northern Europeans | 99.9 /100 | #43 | Exceptional 98.2% |
Demographics Similar to New Zealanders by 4th Grade
In terms of 4th grade, the demographic groups most similar to New Zealanders are Immigrants from Northern Europe (98.0%, a difference of 0.0%), Canadian (98.0%, a difference of 0.0%), Cajun (98.0%, a difference of 0.010%), Kiowa (98.0%, a difference of 0.010%), and Pueblo (98.0%, a difference of 0.010%).
| Demographics | Rating | Rank | 4th Grade |
| Immigrants | Canada | 99.7 /100 | #60 | Exceptional 98.1% |
| Immigrants | North America | 99.7 /100 | #61 | Exceptional 98.1% |
| Serbians | 99.7 /100 | #62 | Exceptional 98.1% |
| Russians | 99.7 /100 | #63 | Exceptional 98.0% |
| Cajuns | 99.7 /100 | #64 | Exceptional 98.0% |
| Immigrants | Northern Europe | 99.6 /100 | #65 | Exceptional 98.0% |
| Canadians | 99.6 /100 | #66 | Exceptional 98.0% |
| New Zealanders | 99.6 /100 | #67 | Exceptional 98.0% |
| Kiowa | 99.6 /100 | #68 | Exceptional 98.0% |
| Pueblo | 99.6 /100 | #69 | Exceptional 98.0% |
| Immigrants | Austria | 99.6 /100 | #70 | Exceptional 98.0% |
| Lumbee | 99.6 /100 | #71 | Exceptional 98.0% |
| Iranians | 99.4 /100 | #72 | Exceptional 98.0% |
| Macedonians | 99.4 /100 | #73 | Exceptional 98.0% |
| Chickasaw | 99.4 /100 | #74 | Exceptional 98.0% |