British vs New Zealander Female Poverty Among 18-24 Year Olds
COMPARE
British
New Zealander
Female Poverty Among 18-24 Year Olds
Female Poverty Among 18-24 Year Olds Comparison
British
New Zealanders
20.7%
FEMALE POVERTY AMONG 18-24 YEAR OLDS
9.4/ 100
METRIC RATING
220th/ 347
METRIC RANK
21.7%
FEMALE POVERTY AMONG 18-24 YEAR OLDS
0.2/ 100
METRIC RATING
273rd/ 347
METRIC RANK
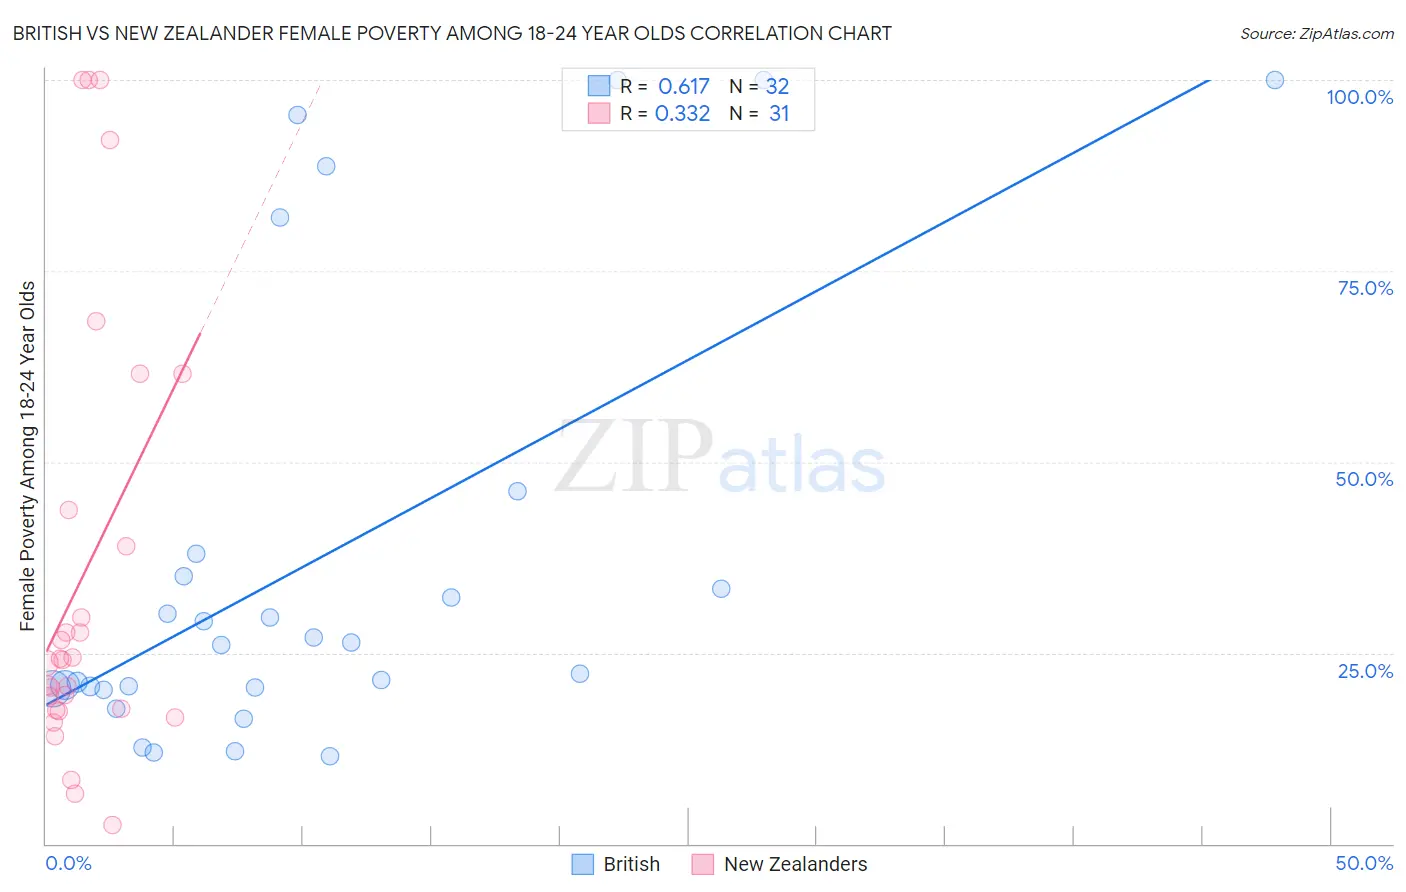
British vs New Zealander Female Poverty Among 18-24 Year Olds Correlation Chart
The statistical analysis conducted on geographies consisting of 506,236,186 people shows a significant positive correlation between the proportion of British and poverty level among females between the ages 18 and 24 in the United States with a correlation coefficient (R) of 0.617 and weighted average of 20.7%. Similarly, the statistical analysis conducted on geographies consisting of 106,255,295 people shows a mild positive correlation between the proportion of New Zealanders and poverty level among females between the ages 18 and 24 in the United States with a correlation coefficient (R) of 0.332 and weighted average of 21.7%, a difference of 5.0%.
Female Poverty Among 18-24 Year Olds Correlation Summary
| Measurement | British | New Zealander |
| Minimum | 11.5% | 2.5% |
| Maximum | 100.0% | 100.0% |
| Range | 88.5% | 97.5% |
| Mean | 37.2% | 35.2% |
| Median | 26.2% | 24.0% |
| Interquartile 25% (IQ1) | 20.4% | 17.5% |
| Interquartile 75% (IQ3) | 36.5% | 43.7% |
| Interquartile Range (IQR) | 16.1% | 26.2% |
| Standard Deviation (Sample) | 29.1% | 28.9% |
| Standard Deviation (Population) | 28.7% | 28.4% |
Similar Demographics by Female Poverty Among 18-24 Year Olds
Demographics Similar to British by Female Poverty Among 18-24 Year Olds
In terms of female poverty among 18-24 year olds, the demographic groups most similar to British are Immigrants from Micronesia (20.7%, a difference of 0.020%), Immigrants from Nepal (20.7%, a difference of 0.030%), Immigrants from Laos (20.6%, a difference of 0.040%), Barbadian (20.7%, a difference of 0.070%), and Immigrants from Western Africa (20.6%, a difference of 0.11%).
| Demographics | Rating | Rank | Female Poverty Among 18-24 Year Olds |
| Northern Europeans | 11.6 /100 | #213 | Poor 20.6% |
| Immigrants | South Africa | 10.7 /100 | #214 | Poor 20.6% |
| Spanish | 10.4 /100 | #215 | Poor 20.6% |
| Immigrants | Western Africa | 10.2 /100 | #216 | Poor 20.6% |
| Immigrants | Laos | 9.7 /100 | #217 | Tragic 20.6% |
| Immigrants | Nepal | 9.6 /100 | #218 | Tragic 20.7% |
| Immigrants | Micronesia | 9.6 /100 | #219 | Tragic 20.7% |
| British | 9.4 /100 | #220 | Tragic 20.7% |
| Barbadians | 9.0 /100 | #221 | Tragic 20.7% |
| Guatemalans | 8.1 /100 | #222 | Tragic 20.7% |
| French | 7.9 /100 | #223 | Tragic 20.7% |
| Immigrants | Liberia | 7.6 /100 | #224 | Tragic 20.7% |
| Norwegians | 7.3 /100 | #225 | Tragic 20.7% |
| Estonians | 7.2 /100 | #226 | Tragic 20.7% |
| Immigrants | Sweden | 6.8 /100 | #227 | Tragic 20.7% |
Demographics Similar to New Zealanders by Female Poverty Among 18-24 Year Olds
In terms of female poverty among 18-24 year olds, the demographic groups most similar to New Zealanders are Basque (21.7%, a difference of 0.14%), Immigrants from Honduras (21.8%, a difference of 0.39%), Scotch-Irish (21.6%, a difference of 0.41%), Mongolian (21.6%, a difference of 0.43%), and Immigrants from Bangladesh (21.8%, a difference of 0.43%).
| Demographics | Rating | Rank | Female Poverty Among 18-24 Year Olds |
| Alaska Natives | 0.3 /100 | #266 | Tragic 21.5% |
| Americans | 0.3 /100 | #267 | Tragic 21.6% |
| Immigrants | Burma/Myanmar | 0.2 /100 | #268 | Tragic 21.6% |
| Celtics | 0.2 /100 | #269 | Tragic 21.6% |
| Mongolians | 0.2 /100 | #270 | Tragic 21.6% |
| Scotch-Irish | 0.2 /100 | #271 | Tragic 21.6% |
| Basques | 0.2 /100 | #272 | Tragic 21.7% |
| New Zealanders | 0.2 /100 | #273 | Tragic 21.7% |
| Immigrants | Honduras | 0.1 /100 | #274 | Tragic 21.8% |
| Immigrants | Bangladesh | 0.1 /100 | #275 | Tragic 21.8% |
| Bahamians | 0.1 /100 | #276 | Tragic 21.8% |
| Immigrants | Switzerland | 0.1 /100 | #277 | Tragic 21.8% |
| Yaqui | 0.1 /100 | #278 | Tragic 21.9% |
| Spanish Americans | 0.1 /100 | #279 | Tragic 21.9% |
| Immigrants | Dominica | 0.1 /100 | #280 | Tragic 21.9% |