British vs Macedonian Median Household Income
COMPARE
British
Macedonian
Median Household Income
Median Household Income Comparison
British
Macedonians
$88,914
MEDIAN HOUSEHOLD INCOME
92.0/ 100
METRIC RATING
130th/ 347
METRIC RANK
$90,761
MEDIAN HOUSEHOLD INCOME
97.4/ 100
METRIC RATING
106th/ 347
METRIC RANK
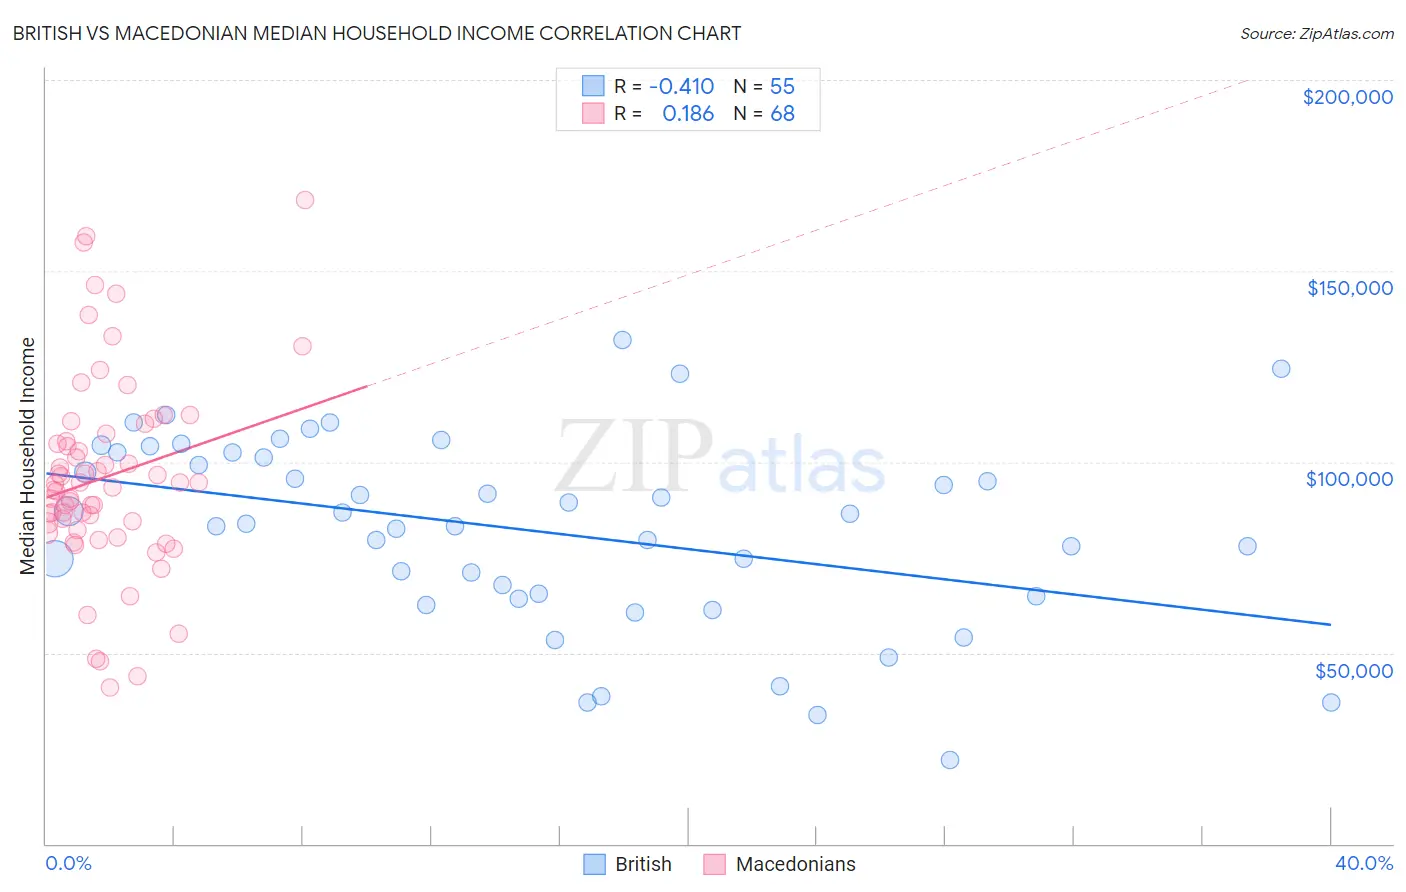
British vs Macedonian Median Household Income Correlation Chart
The statistical analysis conducted on geographies consisting of 530,799,157 people shows a moderate negative correlation between the proportion of British and median household income in the United States with a correlation coefficient (R) of -0.410 and weighted average of $88,914. Similarly, the statistical analysis conducted on geographies consisting of 132,580,342 people shows a poor positive correlation between the proportion of Macedonians and median household income in the United States with a correlation coefficient (R) of 0.186 and weighted average of $90,761, a difference of 2.1%.
Median Household Income Correlation Summary
| Measurement | British | Macedonian |
| Minimum | $21,968 | $40,833 |
| Maximum | $131,817 | $168,448 |
| Range | $109,849 | $127,615 |
| Mean | $81,960 | $96,021 |
| Median | $83,896 | $93,863 |
| Interquartile 25% (IQ1) | $64,868 | $83,085 |
| Interquartile 75% (IQ3) | $102,423 | $106,377 |
| Interquartile Range (IQR) | $37,555 | $23,292 |
| Standard Deviation (Sample) | $24,875 | $25,740 |
| Standard Deviation (Population) | $24,648 | $25,550 |
Similar Demographics by Median Household Income
Demographics Similar to British by Median Household Income
In terms of median household income, the demographic groups most similar to British are Brazilian ($88,934, a difference of 0.020%), Portuguese ($88,976, a difference of 0.070%), Immigrants from Peru ($89,010, a difference of 0.11%), Immigrants from Syria ($88,792, a difference of 0.14%), and European ($88,751, a difference of 0.18%).
| Demographics | Rating | Rank | Median Household Income |
| Immigrants | Zimbabwe | 94.4 /100 | #123 | Exceptional $89,496 |
| Immigrants | Jordan | 94.1 /100 | #124 | Exceptional $89,412 |
| Immigrants | Kuwait | 93.5 /100 | #125 | Exceptional $89,263 |
| Immigrants | Oceania | 92.9 /100 | #126 | Exceptional $89,100 |
| Immigrants | Peru | 92.5 /100 | #127 | Exceptional $89,010 |
| Portuguese | 92.3 /100 | #128 | Exceptional $88,976 |
| Brazilians | 92.1 /100 | #129 | Exceptional $88,934 |
| British | 92.0 /100 | #130 | Exceptional $88,914 |
| Immigrants | Syria | 91.4 /100 | #131 | Exceptional $88,792 |
| Europeans | 91.2 /100 | #132 | Exceptional $88,751 |
| Immigrants | Ethiopia | 90.9 /100 | #133 | Exceptional $88,687 |
| Swedes | 90.0 /100 | #134 | Exceptional $88,524 |
| Immigrants | Sierra Leone | 89.9 /100 | #135 | Excellent $88,498 |
| Poles | 89.7 /100 | #136 | Excellent $88,472 |
| Sierra Leoneans | 89.6 /100 | #137 | Excellent $88,463 |
Demographics Similar to Macedonians by Median Household Income
In terms of median household income, the demographic groups most similar to Macedonians are Croatian ($90,685, a difference of 0.080%), Immigrants from Brazil ($90,907, a difference of 0.16%), Zimbabwean ($90,618, a difference of 0.16%), Chilean ($90,605, a difference of 0.17%), and Palestinian ($90,574, a difference of 0.21%).
| Demographics | Rating | Rank | Median Household Income |
| Immigrants | South Eastern Asia | 98.4 /100 | #99 | Exceptional $91,541 |
| Ukrainians | 98.3 /100 | #100 | Exceptional $91,456 |
| Immigrants | Moldova | 98.3 /100 | #101 | Exceptional $91,446 |
| Austrians | 98.2 /100 | #102 | Exceptional $91,339 |
| Immigrants | Ukraine | 98.0 /100 | #103 | Exceptional $91,124 |
| Immigrants | Kazakhstan | 97.8 /100 | #104 | Exceptional $91,015 |
| Immigrants | Brazil | 97.7 /100 | #105 | Exceptional $90,907 |
| Macedonians | 97.4 /100 | #106 | Exceptional $90,761 |
| Croatians | 97.3 /100 | #107 | Exceptional $90,685 |
| Zimbabweans | 97.2 /100 | #108 | Exceptional $90,618 |
| Chileans | 97.2 /100 | #109 | Exceptional $90,605 |
| Palestinians | 97.1 /100 | #110 | Exceptional $90,574 |
| Immigrants | Poland | 97.1 /100 | #111 | Exceptional $90,549 |
| Northern Europeans | 96.9 /100 | #112 | Exceptional $90,446 |
| Peruvians | 96.5 /100 | #113 | Exceptional $90,261 |