British vs Croatian Professional Degree
COMPARE
British
Croatian
Professional Degree
Professional Degree Comparison
British
Croatians
5.0%
PROFESSIONAL DEGREE
98.0/ 100
METRIC RATING
109th/ 347
METRIC RANK
4.9%
PROFESSIONAL DEGREE
96.0/ 100
METRIC RATING
118th/ 347
METRIC RANK
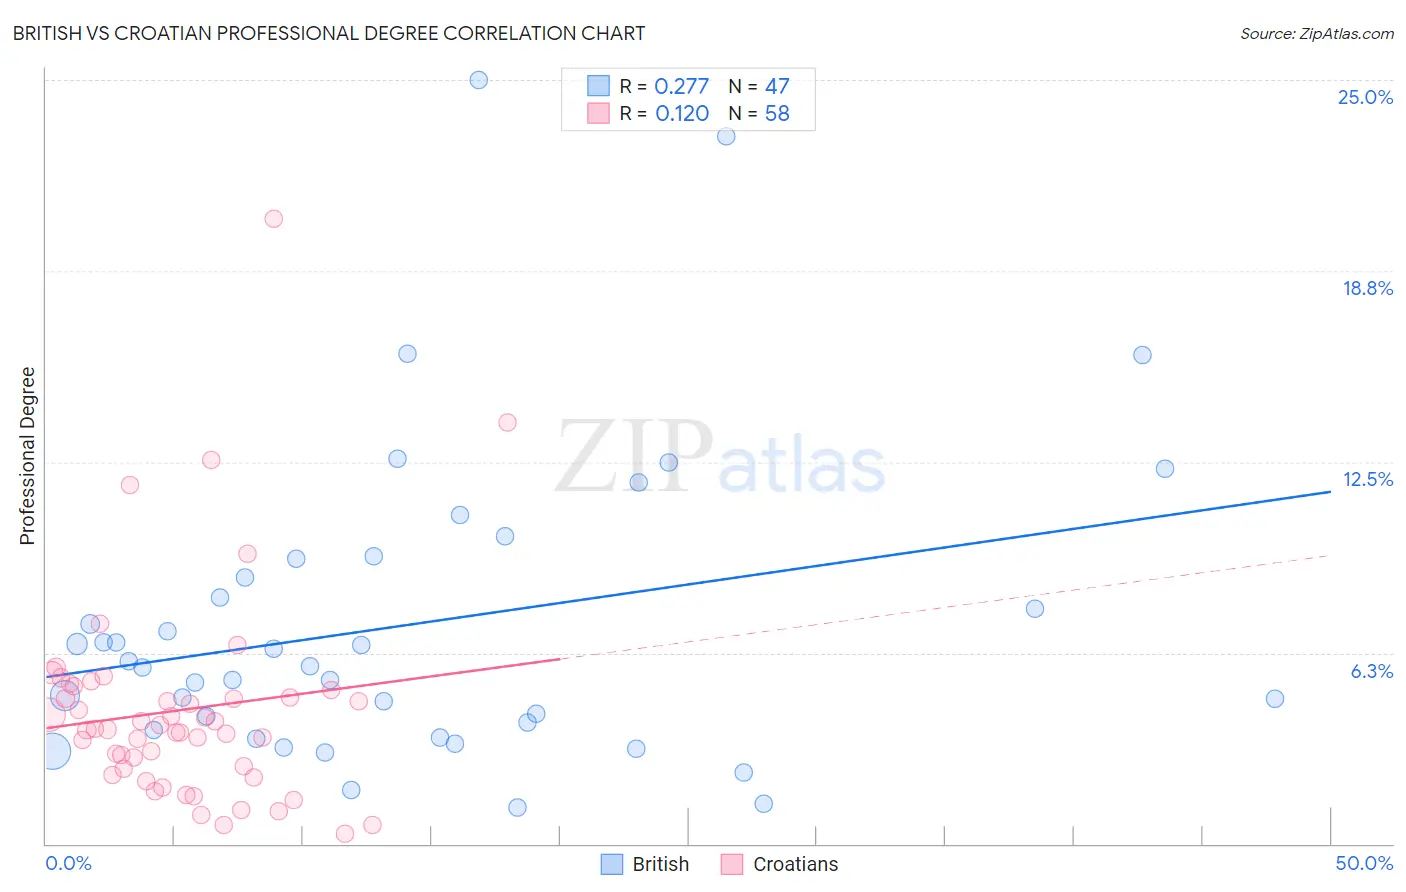
British vs Croatian Professional Degree Correlation Chart
The statistical analysis conducted on geographies consisting of 527,483,146 people shows a weak positive correlation between the proportion of British and percentage of population with at least professional degree education in the United States with a correlation coefficient (R) of 0.277 and weighted average of 5.0%. Similarly, the statistical analysis conducted on geographies consisting of 374,896,784 people shows a poor positive correlation between the proportion of Croatians and percentage of population with at least professional degree education in the United States with a correlation coefficient (R) of 0.120 and weighted average of 4.9%, a difference of 2.4%.
Professional Degree Correlation Summary
| Measurement | British | Croatian |
| Minimum | 1.2% | 0.32% |
| Maximum | 25.0% | 20.4% |
| Range | 23.8% | 20.1% |
| Mean | 7.2% | 4.4% |
| Median | 5.8% | 3.8% |
| Interquartile 25% (IQ1) | 3.7% | 2.4% |
| Interquartile 75% (IQ3) | 9.3% | 5.0% |
| Interquartile Range (IQR) | 5.6% | 2.6% |
| Standard Deviation (Sample) | 5.1% | 3.4% |
| Standard Deviation (Population) | 5.0% | 3.4% |
Demographics Similar to British and Croatians by Professional Degree
In terms of professional degree, the demographic groups most similar to British are Immigrants from Southern Europe (5.0%, a difference of 0.020%), Maltese (5.0%, a difference of 0.060%), Lebanese (5.0%, a difference of 0.15%), Immigrants from Ukraine (5.0%, a difference of 0.18%), and Immigrants from Uganda (5.0%, a difference of 0.21%). Similarly, the demographic groups most similar to Croatians are Immigrants from Syria (4.9%, a difference of 0.0%), Venezuelan (4.9%, a difference of 0.21%), Immigrants from Sudan (4.9%, a difference of 0.54%), Albanian (4.9%, a difference of 0.55%), and Moroccan (5.0%, a difference of 0.68%).
| Demographics | Rating | Rank | Professional Degree |
| Immigrants | Northern Africa | 98.4 /100 | #103 | Exceptional 5.1% |
| Arabs | 98.2 /100 | #104 | Exceptional 5.0% |
| Immigrants | Uganda | 98.2 /100 | #105 | Exceptional 5.0% |
| Immigrants | Ukraine | 98.2 /100 | #106 | Exceptional 5.0% |
| Maltese | 98.1 /100 | #107 | Exceptional 5.0% |
| Immigrants | Southern Europe | 98.1 /100 | #108 | Exceptional 5.0% |
| British | 98.0 /100 | #109 | Exceptional 5.0% |
| Lebanese | 98.0 /100 | #110 | Exceptional 5.0% |
| Brazilians | 97.4 /100 | #111 | Exceptional 5.0% |
| Taiwanese | 97.3 /100 | #112 | Exceptional 5.0% |
| Immigrants | Pakistan | 97.2 /100 | #113 | Exceptional 5.0% |
| Immigrants | Morocco | 96.8 /100 | #114 | Exceptional 5.0% |
| Moroccans | 96.8 /100 | #115 | Exceptional 5.0% |
| Venezuelans | 96.3 /100 | #116 | Exceptional 4.9% |
| Immigrants | Syria | 96.0 /100 | #117 | Exceptional 4.9% |
| Croatians | 96.0 /100 | #118 | Exceptional 4.9% |
| Immigrants | Sudan | 95.4 /100 | #119 | Exceptional 4.9% |
| Albanians | 95.3 /100 | #120 | Exceptional 4.9% |
| Immigrants | Moldova | 94.8 /100 | #121 | Exceptional 4.9% |
| Immigrants | Germany | 94.1 /100 | #122 | Exceptional 4.9% |
| Immigrants | Venezuela | 93.8 /100 | #123 | Exceptional 4.8% |