British vs Croatian 12th Grade, No Diploma
COMPARE
British
Croatian
12th Grade, No Diploma
12th Grade, No Diploma Comparison
British
Croatians
92.9%
12TH GRADE, NO DIPLOMA
99.8/ 100
METRIC RATING
46th/ 347
METRIC RANK
93.5%
12TH GRADE, NO DIPLOMA
100.0/ 100
METRIC RATING
10th/ 347
METRIC RANK
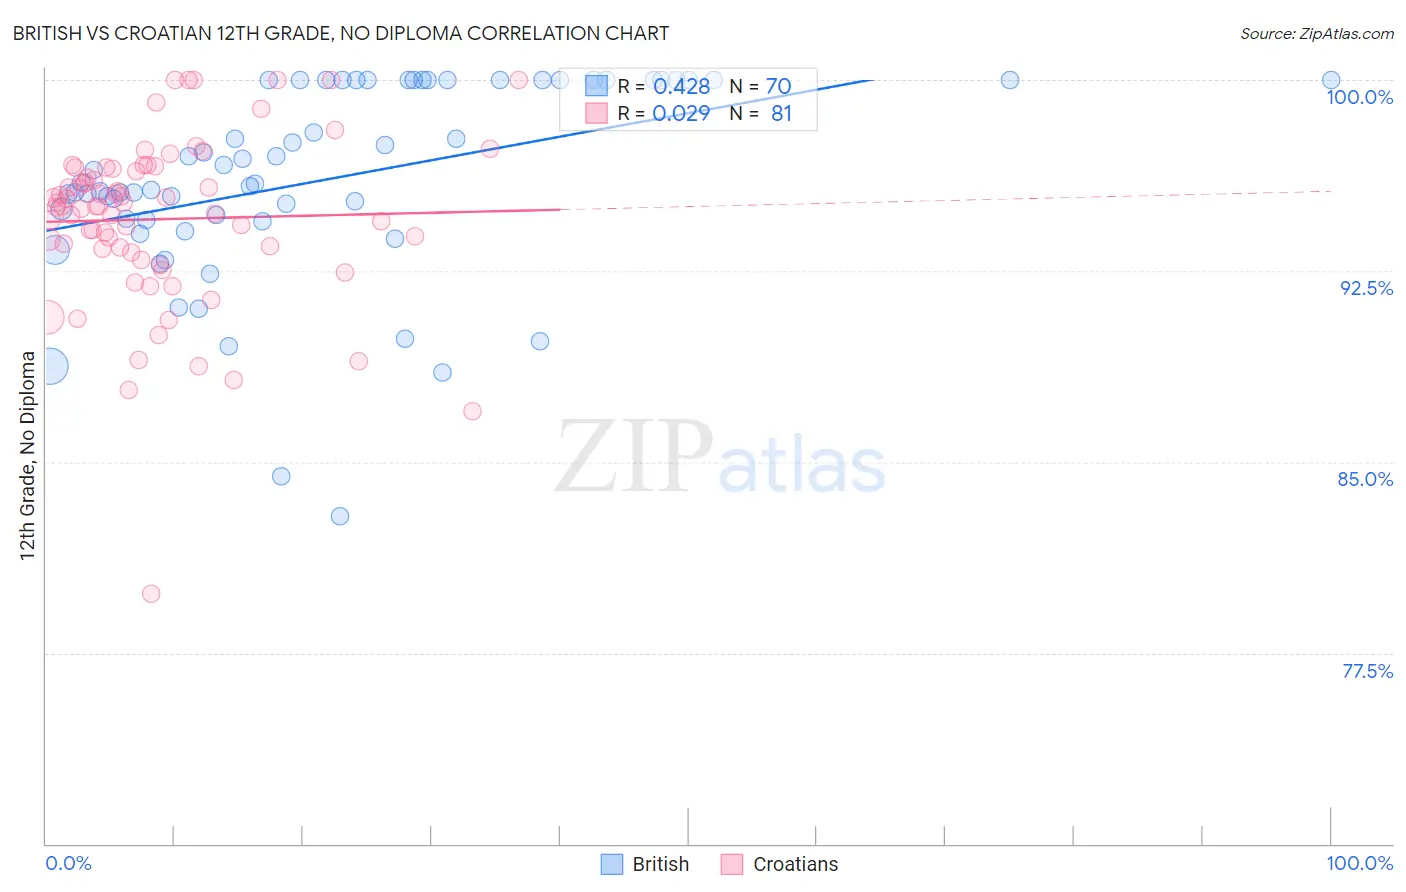
British vs Croatian 12th Grade, No Diploma Correlation Chart
The statistical analysis conducted on geographies consisting of 531,463,483 people shows a moderate positive correlation between the proportion of British and percentage of population with at least 12th grade (no diploma) education in the United States with a correlation coefficient (R) of 0.428 and weighted average of 92.9%. Similarly, the statistical analysis conducted on geographies consisting of 375,733,787 people shows no correlation between the proportion of Croatians and percentage of population with at least 12th grade (no diploma) education in the United States with a correlation coefficient (R) of 0.029 and weighted average of 93.5%, a difference of 0.69%.
12th Grade, No Diploma Correlation Summary
| Measurement | British | Croatian |
| Minimum | 82.9% | 79.8% |
| Maximum | 100.0% | 100.0% |
| Range | 17.1% | 20.2% |
| Mean | 96.1% | 94.5% |
| Median | 96.0% | 95.0% |
| Interquartile 25% (IQ1) | 94.5% | 93.3% |
| Interquartile 75% (IQ3) | 100.0% | 96.5% |
| Interquartile Range (IQR) | 5.5% | 3.2% |
| Standard Deviation (Sample) | 3.9% | 3.3% |
| Standard Deviation (Population) | 3.8% | 3.3% |
Similar Demographics by 12th Grade, No Diploma
Demographics Similar to British by 12th Grade, No Diploma
In terms of 12th grade, no diploma, the demographic groups most similar to British are Greek (92.9%, a difference of 0.010%), Belgian (92.9%, a difference of 0.010%), Northern European (92.9%, a difference of 0.020%), Dutch (92.9%, a difference of 0.020%), and Australian (92.9%, a difference of 0.020%).
| Demographics | Rating | Rank | 12th Grade, No Diploma |
| Immigrants | Austria | 99.8 /100 | #39 | Exceptional 93.0% |
| Turks | 99.8 /100 | #40 | Exceptional 93.0% |
| Bhutanese | 99.8 /100 | #41 | Exceptional 93.0% |
| Immigrants | Australia | 99.8 /100 | #42 | Exceptional 92.9% |
| Northern Europeans | 99.8 /100 | #43 | Exceptional 92.9% |
| Dutch | 99.8 /100 | #44 | Exceptional 92.9% |
| Greeks | 99.8 /100 | #45 | Exceptional 92.9% |
| British | 99.8 /100 | #46 | Exceptional 92.9% |
| Belgians | 99.8 /100 | #47 | Exceptional 92.9% |
| Australians | 99.8 /100 | #48 | Exceptional 92.9% |
| Macedonians | 99.8 /100 | #49 | Exceptional 92.9% |
| Tsimshian | 99.8 /100 | #50 | Exceptional 92.9% |
| Immigrants | Belgium | 99.8 /100 | #51 | Exceptional 92.9% |
| Immigrants | Sweden | 99.8 /100 | #52 | Exceptional 92.8% |
| Serbians | 99.7 /100 | #53 | Exceptional 92.8% |
Demographics Similar to Croatians by 12th Grade, No Diploma
In terms of 12th grade, no diploma, the demographic groups most similar to Croatians are Latvian (93.6%, a difference of 0.020%), Slovak (93.6%, a difference of 0.030%), Chinese (93.6%, a difference of 0.030%), Polish (93.5%, a difference of 0.060%), and Eastern European (93.5%, a difference of 0.060%).
| Demographics | Rating | Rank | 12th Grade, No Diploma |
| Lithuanians | 100.0 /100 | #3 | Exceptional 93.6% |
| Slovenes | 100.0 /100 | #4 | Exceptional 93.6% |
| Carpatho Rusyns | 100.0 /100 | #5 | Exceptional 93.6% |
| Immigrants | India | 100.0 /100 | #6 | Exceptional 93.6% |
| Slovaks | 100.0 /100 | #7 | Exceptional 93.6% |
| Chinese | 100.0 /100 | #8 | Exceptional 93.6% |
| Latvians | 100.0 /100 | #9 | Exceptional 93.6% |
| Croatians | 100.0 /100 | #10 | Exceptional 93.5% |
| Poles | 100.0 /100 | #11 | Exceptional 93.5% |
| Eastern Europeans | 100.0 /100 | #12 | Exceptional 93.5% |
| Danes | 100.0 /100 | #13 | Exceptional 93.5% |
| Bulgarians | 100.0 /100 | #14 | Exceptional 93.5% |
| Finns | 100.0 /100 | #15 | Exceptional 93.4% |
| Maltese | 100.0 /100 | #16 | Exceptional 93.3% |
| Luxembourgers | 100.0 /100 | #17 | Exceptional 93.3% |