Panamanian vs Slavic Family Households with Children
COMPARE
Panamanian
Slavic
Family Households with Children
Family Households with Children Comparison
Panamanians
Slavs
28.2%
FAMILY HOUSEHOLDS WITH CHILDREN
99.3/ 100
METRIC RATING
93rd/ 347
METRIC RANK
26.8%
FAMILY HOUSEHOLDS WITH CHILDREN
1.3/ 100
METRIC RATING
257th/ 347
METRIC RANK
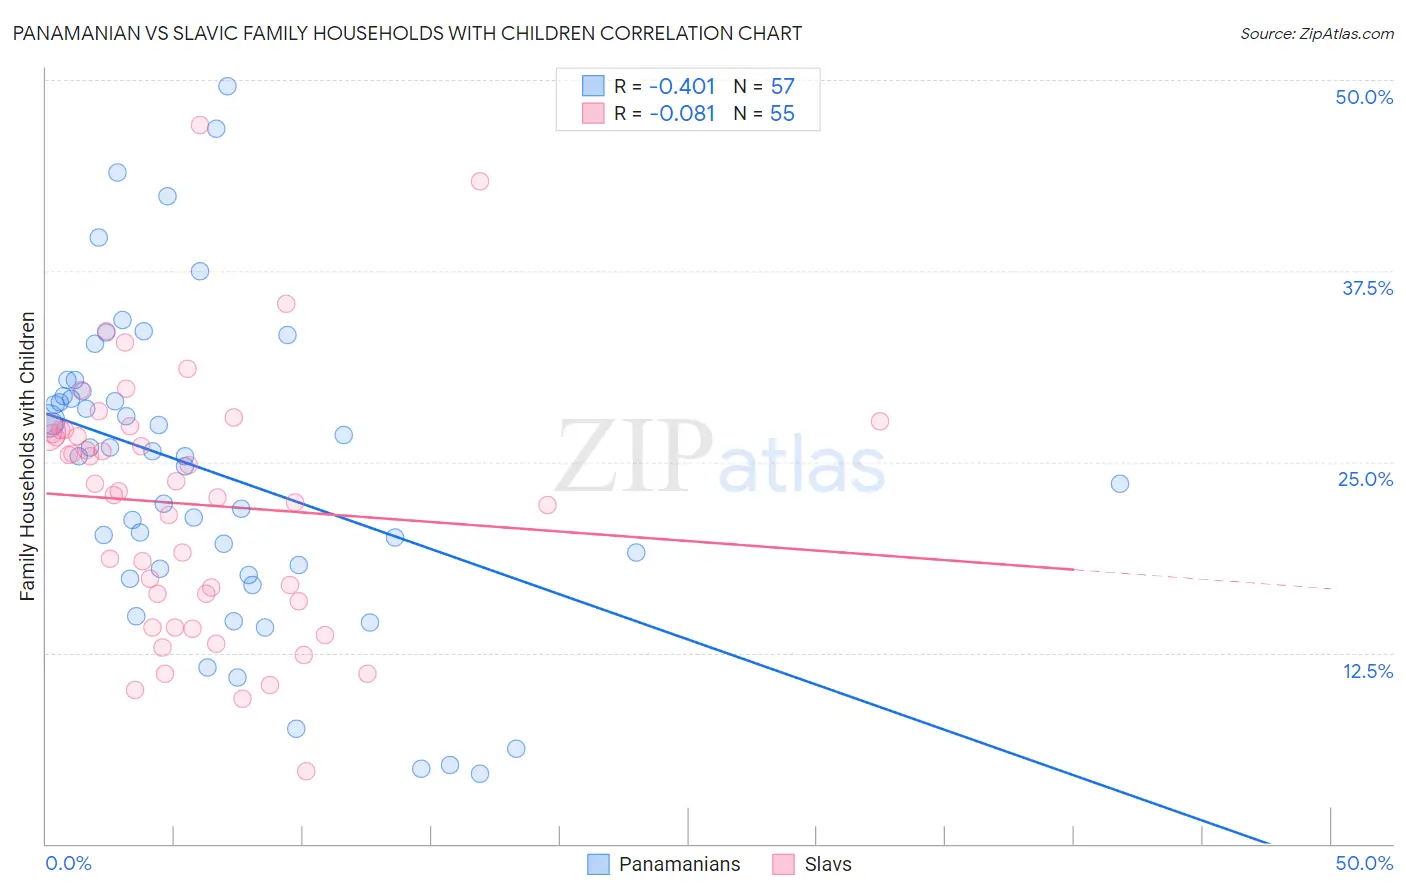
Panamanian vs Slavic Family Households with Children Correlation Chart
The statistical analysis conducted on geographies consisting of 281,035,493 people shows a moderate negative correlation between the proportion of Panamanians and percentage of family households with children in the United States with a correlation coefficient (R) of -0.401 and weighted average of 28.2%. Similarly, the statistical analysis conducted on geographies consisting of 270,744,912 people shows a slight negative correlation between the proportion of Slavs and percentage of family households with children in the United States with a correlation coefficient (R) of -0.081 and weighted average of 26.8%, a difference of 5.2%.
Family Households with Children Correlation Summary
| Measurement | Panamanian | Slavic |
| Minimum | 4.6% | 4.7% |
| Maximum | 49.6% | 47.1% |
| Range | 45.0% | 42.3% |
| Mean | 24.4% | 22.2% |
| Median | 25.4% | 23.1% |
| Interquartile 25% (IQ1) | 17.8% | 15.9% |
| Interquartile 75% (IQ3) | 29.4% | 27.1% |
| Interquartile Range (IQR) | 11.7% | 11.2% |
| Standard Deviation (Sample) | 10.2% | 8.4% |
| Standard Deviation (Population) | 10.1% | 8.3% |
Similar Demographics by Family Households with Children
Demographics Similar to Panamanians by Family Households with Children
In terms of family households with children, the demographic groups most similar to Panamanians are Immigrants from Colombia (28.2%, a difference of 0.050%), Chickasaw (28.2%, a difference of 0.11%), Immigrants from Nicaragua (28.2%, a difference of 0.11%), Immigrants from Liberia (28.2%, a difference of 0.13%), and Ute (28.2%, a difference of 0.14%).
| Demographics | Rating | Rank | Family Households with Children |
| Immigrants | Western Africa | 99.6 /100 | #86 | Exceptional 28.3% |
| Colombians | 99.6 /100 | #87 | Exceptional 28.3% |
| Liberians | 99.6 /100 | #88 | Exceptional 28.3% |
| Immigrants | Costa Rica | 99.6 /100 | #89 | Exceptional 28.3% |
| Immigrants | Thailand | 99.5 /100 | #90 | Exceptional 28.2% |
| Immigrants | Liberia | 99.4 /100 | #91 | Exceptional 28.2% |
| Chickasaw | 99.4 /100 | #92 | Exceptional 28.2% |
| Panamanians | 99.3 /100 | #93 | Exceptional 28.2% |
| Immigrants | Colombia | 99.2 /100 | #94 | Exceptional 28.2% |
| Immigrants | Nicaragua | 99.1 /100 | #95 | Exceptional 28.2% |
| Ute | 99.1 /100 | #96 | Exceptional 28.2% |
| Chileans | 98.9 /100 | #97 | Exceptional 28.1% |
| Immigrants | Kenya | 98.9 /100 | #98 | Exceptional 28.1% |
| Immigrants | Azores | 98.8 /100 | #99 | Exceptional 28.1% |
| Indonesians | 98.8 /100 | #100 | Exceptional 28.1% |
Demographics Similar to Slavs by Family Households with Children
In terms of family households with children, the demographic groups most similar to Slavs are Immigrants from Cuba (26.8%, a difference of 0.010%), Immigrants from Lithuania (26.8%, a difference of 0.040%), Scotch-Irish (26.8%, a difference of 0.050%), Immigrants from Jamaica (26.8%, a difference of 0.050%), and German Russian (26.8%, a difference of 0.060%).
| Demographics | Rating | Rank | Family Households with Children |
| Belgians | 2.1 /100 | #250 | Tragic 26.9% |
| Immigrants | Bosnia and Herzegovina | 1.9 /100 | #251 | Tragic 26.8% |
| Irish | 1.8 /100 | #252 | Tragic 26.8% |
| Italians | 1.5 /100 | #253 | Tragic 26.8% |
| Immigrants | Scotland | 1.5 /100 | #254 | Tragic 26.8% |
| German Russians | 1.5 /100 | #255 | Tragic 26.8% |
| Scotch-Irish | 1.4 /100 | #256 | Tragic 26.8% |
| Slavs | 1.3 /100 | #257 | Tragic 26.8% |
| Immigrants | Cuba | 1.3 /100 | #258 | Tragic 26.8% |
| Immigrants | Lithuania | 1.2 /100 | #259 | Tragic 26.8% |
| Immigrants | Jamaica | 1.2 /100 | #260 | Tragic 26.8% |
| Immigrants | Belarus | 1.1 /100 | #261 | Tragic 26.8% |
| Immigrants | Russia | 1.0 /100 | #262 | Tragic 26.8% |
| Immigrants | North Macedonia | 1.0 /100 | #263 | Tragic 26.7% |
| Taiwanese | 0.9 /100 | #264 | Tragic 26.7% |