Black/African American vs Ukrainian Married-couple Households
COMPARE
Black/African American
Ukrainian
Married-couple Households
Married-couple Households Comparison
Blacks/African Americans
Ukrainians
38.5%
MARRIED-COUPLE HOUSEHOLDS
0.0/ 100
METRIC RATING
336th/ 347
METRIC RANK
48.1%
MARRIED-COUPLE HOUSEHOLDS
97.6/ 100
METRIC RATING
84th/ 347
METRIC RANK
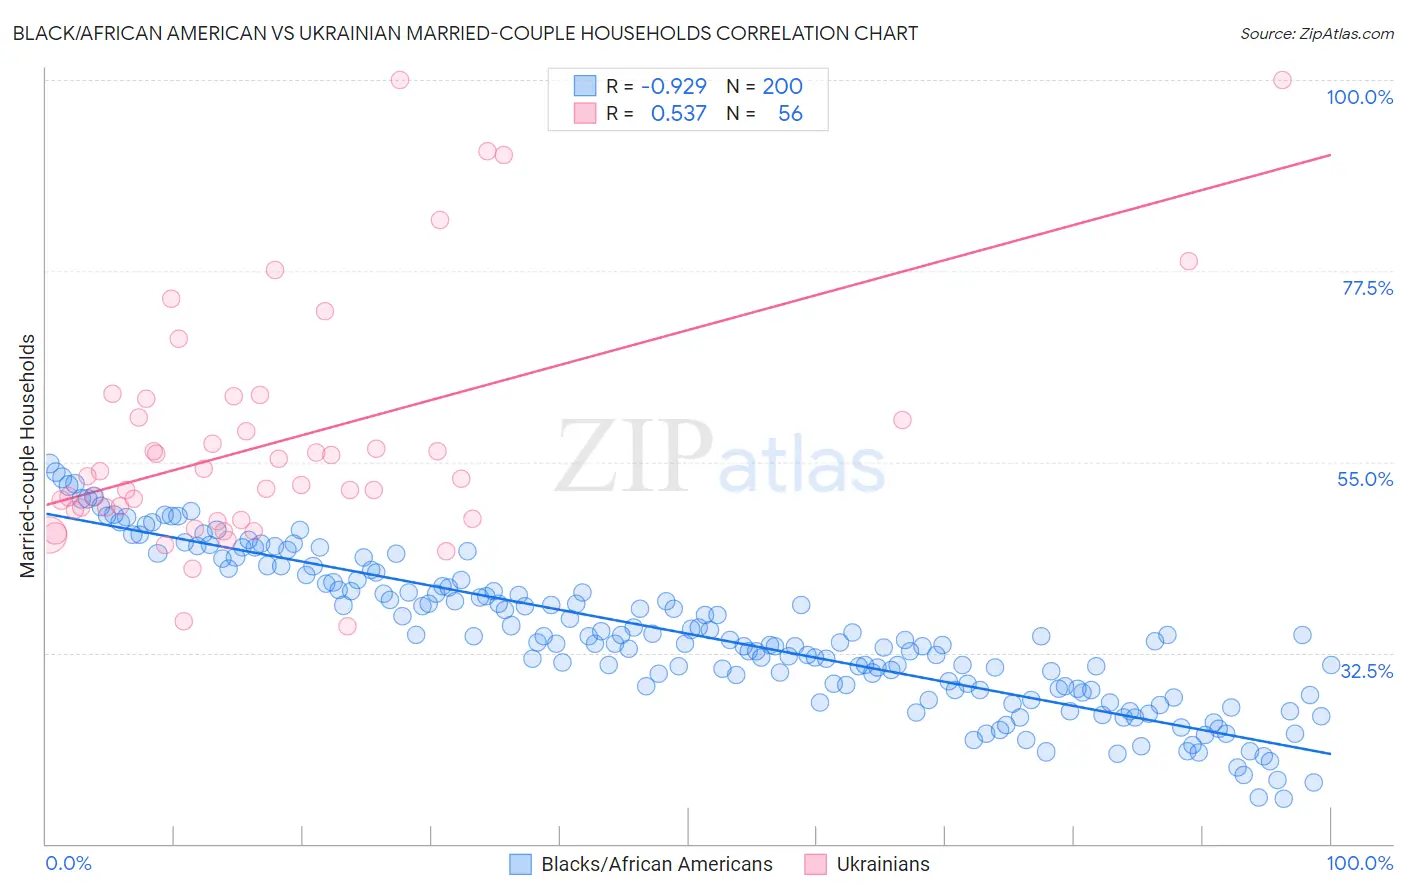
Black/African American vs Ukrainian Married-couple Households Correlation Chart
The statistical analysis conducted on geographies consisting of 565,301,242 people shows a near-perfect negative correlation between the proportion of Blacks/African Americans and percentage of married-couple family households in the United States with a correlation coefficient (R) of -0.929 and weighted average of 38.5%. Similarly, the statistical analysis conducted on geographies consisting of 448,301,259 people shows a substantial positive correlation between the proportion of Ukrainians and percentage of married-couple family households in the United States with a correlation coefficient (R) of 0.537 and weighted average of 48.1%, a difference of 24.9%.
Married-couple Households Correlation Summary
| Measurement | Black/African American | Ukrainian |
| Minimum | 15.3% | 35.6% |
| Maximum | 54.8% | 100.0% |
| Range | 39.5% | 64.4% |
| Mean | 34.7% | 57.5% |
| Median | 34.0% | 53.1% |
| Interquartile 25% (IQ1) | 28.3% | 48.8% |
| Interquartile 75% (IQ3) | 41.0% | 61.3% |
| Interquartile Range (IQR) | 12.7% | 12.5% |
| Standard Deviation (Sample) | 8.8% | 14.4% |
| Standard Deviation (Population) | 8.8% | 14.2% |
Similar Demographics by Married-couple Households
Demographics Similar to Blacks/African Americans by Married-couple Households
In terms of married-couple households, the demographic groups most similar to Blacks/African Americans are Immigrants from Somalia (38.4%, a difference of 0.14%), Senegalese (38.6%, a difference of 0.18%), Immigrants from Senegal (38.4%, a difference of 0.30%), British West Indian (38.3%, a difference of 0.43%), and Immigrants from St. Vincent and the Grenadines (38.7%, a difference of 0.51%).
| Demographics | Rating | Rank | Married-couple Households |
| Immigrants | Dominica | 0.0 /100 | #329 | Tragic 39.4% |
| Immigrants | Barbados | 0.0 /100 | #330 | Tragic 39.2% |
| Immigrants | Congo | 0.0 /100 | #331 | Tragic 39.0% |
| Somalis | 0.0 /100 | #332 | Tragic 39.0% |
| Immigrants | West Indies | 0.0 /100 | #333 | Tragic 39.0% |
| Immigrants | St. Vincent and the Grenadines | 0.0 /100 | #334 | Tragic 38.7% |
| Senegalese | 0.0 /100 | #335 | Tragic 38.6% |
| Blacks/African Americans | 0.0 /100 | #336 | Tragic 38.5% |
| Immigrants | Somalia | 0.0 /100 | #337 | Tragic 38.4% |
| Immigrants | Senegal | 0.0 /100 | #338 | Tragic 38.4% |
| British West Indians | 0.0 /100 | #339 | Tragic 38.3% |
| Dominicans | 0.0 /100 | #340 | Tragic 38.2% |
| Cape Verdeans | 0.0 /100 | #341 | Tragic 38.1% |
| Tohono O'odham | 0.0 /100 | #342 | Tragic 37.9% |
| Immigrants | Grenada | 0.0 /100 | #343 | Tragic 37.5% |
Demographics Similar to Ukrainians by Married-couple Households
In terms of married-couple households, the demographic groups most similar to Ukrainians are Guamanian/Chamorro (48.1%, a difference of 0.020%), Immigrants from Poland (48.1%, a difference of 0.040%), Immigrants from Israel (48.0%, a difference of 0.050%), Belgian (48.0%, a difference of 0.070%), and Immigrants from Ireland (48.0%, a difference of 0.080%).
| Demographics | Rating | Rank | Married-couple Households |
| Canadians | 98.2 /100 | #77 | Exceptional 48.2% |
| Egyptians | 98.2 /100 | #78 | Exceptional 48.2% |
| Immigrants | Netherlands | 98.2 /100 | #79 | Exceptional 48.2% |
| Russians | 98.1 /100 | #80 | Exceptional 48.2% |
| Finns | 98.0 /100 | #81 | Exceptional 48.1% |
| Immigrants | Poland | 97.7 /100 | #82 | Exceptional 48.1% |
| Guamanians/Chamorros | 97.6 /100 | #83 | Exceptional 48.1% |
| Ukrainians | 97.6 /100 | #84 | Exceptional 48.1% |
| Immigrants | Israel | 97.4 /100 | #85 | Exceptional 48.0% |
| Belgians | 97.4 /100 | #86 | Exceptional 48.0% |
| Immigrants | Ireland | 97.3 /100 | #87 | Exceptional 48.0% |
| Afghans | 97.3 /100 | #88 | Exceptional 48.0% |
| Cypriots | 97.2 /100 | #89 | Exceptional 48.0% |
| French | 97.2 /100 | #90 | Exceptional 48.0% |
| Immigrants | Moldova | 97.0 /100 | #91 | Exceptional 48.0% |