Black/African American vs Immigrants from the Azores Married-couple Households
COMPARE
Black/African American
Immigrants from the Azores
Married-couple Households
Married-couple Households Comparison
Blacks/African Americans
Immigrants from the Azores
38.5%
MARRIED-COUPLE HOUSEHOLDS
0.0/ 100
METRIC RATING
336th/ 347
METRIC RANK
45.2%
MARRIED-COUPLE HOUSEHOLDS
5.3/ 100
METRIC RATING
218th/ 347
METRIC RANK
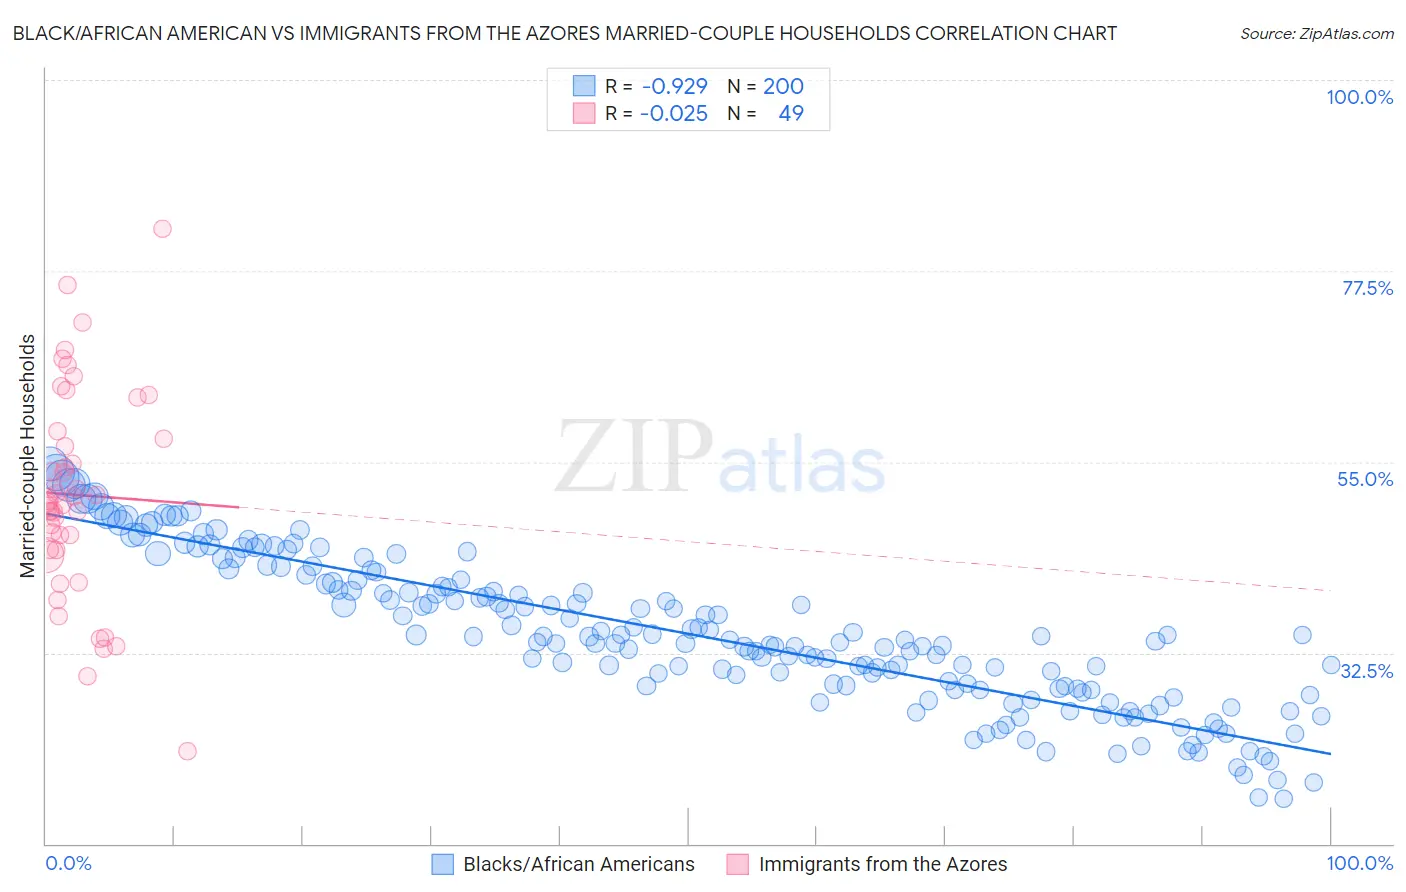
Black/African American vs Immigrants from the Azores Married-couple Households Correlation Chart
The statistical analysis conducted on geographies consisting of 565,301,242 people shows a near-perfect negative correlation between the proportion of Blacks/African Americans and percentage of married-couple family households in the United States with a correlation coefficient (R) of -0.929 and weighted average of 38.5%. Similarly, the statistical analysis conducted on geographies consisting of 46,257,310 people shows no correlation between the proportion of Immigrants from the Azores and percentage of married-couple family households in the United States with a correlation coefficient (R) of -0.025 and weighted average of 45.2%, a difference of 17.4%.
Married-couple Households Correlation Summary
| Measurement | Black/African American | Immigrants from the Azores |
| Minimum | 15.3% | 21.0% |
| Maximum | 54.8% | 82.5% |
| Range | 39.5% | 61.5% |
| Mean | 34.7% | 51.1% |
| Median | 34.0% | 50.2% |
| Interquartile 25% (IQ1) | 28.3% | 44.7% |
| Interquartile 75% (IQ3) | 41.0% | 58.1% |
| Interquartile Range (IQR) | 12.7% | 13.4% |
| Standard Deviation (Sample) | 8.8% | 12.2% |
| Standard Deviation (Population) | 8.8% | 12.1% |
Similar Demographics by Married-couple Households
Demographics Similar to Blacks/African Americans by Married-couple Households
In terms of married-couple households, the demographic groups most similar to Blacks/African Americans are Immigrants from Somalia (38.4%, a difference of 0.14%), Senegalese (38.6%, a difference of 0.18%), Immigrants from Senegal (38.4%, a difference of 0.30%), British West Indian (38.3%, a difference of 0.43%), and Immigrants from St. Vincent and the Grenadines (38.7%, a difference of 0.51%).
| Demographics | Rating | Rank | Married-couple Households |
| Immigrants | Dominica | 0.0 /100 | #329 | Tragic 39.4% |
| Immigrants | Barbados | 0.0 /100 | #330 | Tragic 39.2% |
| Immigrants | Congo | 0.0 /100 | #331 | Tragic 39.0% |
| Somalis | 0.0 /100 | #332 | Tragic 39.0% |
| Immigrants | West Indies | 0.0 /100 | #333 | Tragic 39.0% |
| Immigrants | St. Vincent and the Grenadines | 0.0 /100 | #334 | Tragic 38.7% |
| Senegalese | 0.0 /100 | #335 | Tragic 38.6% |
| Blacks/African Americans | 0.0 /100 | #336 | Tragic 38.5% |
| Immigrants | Somalia | 0.0 /100 | #337 | Tragic 38.4% |
| Immigrants | Senegal | 0.0 /100 | #338 | Tragic 38.4% |
| British West Indians | 0.0 /100 | #339 | Tragic 38.3% |
| Dominicans | 0.0 /100 | #340 | Tragic 38.2% |
| Cape Verdeans | 0.0 /100 | #341 | Tragic 38.1% |
| Tohono O'odham | 0.0 /100 | #342 | Tragic 37.9% |
| Immigrants | Grenada | 0.0 /100 | #343 | Tragic 37.5% |
Demographics Similar to Immigrants from the Azores by Married-couple Households
In terms of married-couple households, the demographic groups most similar to Immigrants from the Azores are Nicaraguan (45.2%, a difference of 0.010%), Panamanian (45.2%, a difference of 0.030%), Immigrants from Thailand (45.2%, a difference of 0.040%), Immigrants from Nepal (45.2%, a difference of 0.050%), and Immigrants from Portugal (45.2%, a difference of 0.050%).
| Demographics | Rating | Rank | Married-couple Households |
| Immigrants | Spain | 7.3 /100 | #211 | Tragic 45.3% |
| Creek | 6.4 /100 | #212 | Tragic 45.3% |
| Yakama | 5.8 /100 | #213 | Tragic 45.2% |
| Japanese | 5.7 /100 | #214 | Tragic 45.2% |
| Immigrants | Nepal | 5.6 /100 | #215 | Tragic 45.2% |
| Immigrants | Portugal | 5.6 /100 | #216 | Tragic 45.2% |
| Panamanians | 5.5 /100 | #217 | Tragic 45.2% |
| Immigrants | Azores | 5.3 /100 | #218 | Tragic 45.2% |
| Nicaraguans | 5.3 /100 | #219 | Tragic 45.2% |
| Immigrants | Thailand | 5.1 /100 | #220 | Tragic 45.2% |
| Tlingit-Haida | 4.9 /100 | #221 | Tragic 45.1% |
| Immigrants | Laos | 4.6 /100 | #222 | Tragic 45.1% |
| Immigrants | Cambodia | 2.7 /100 | #223 | Tragic 44.9% |
| Immigrants | Micronesia | 2.6 /100 | #224 | Tragic 44.9% |
| Dutch West Indians | 2.6 /100 | #225 | Tragic 44.9% |