Black/African American vs Lithuanian Disability Age 35 to 64
COMPARE
Black/African American
Lithuanian
Disability Age 35 to 64
Disability Age 35 to 64 Comparison
Blacks/African Americans
Lithuanians
14.7%
DISABILITY AGE 35 TO 64
0.0/ 100
METRIC RATING
320th/ 347
METRIC RANK
10.8%
DISABILITY AGE 35 TO 64
88.7/ 100
METRIC RATING
144th/ 347
METRIC RANK
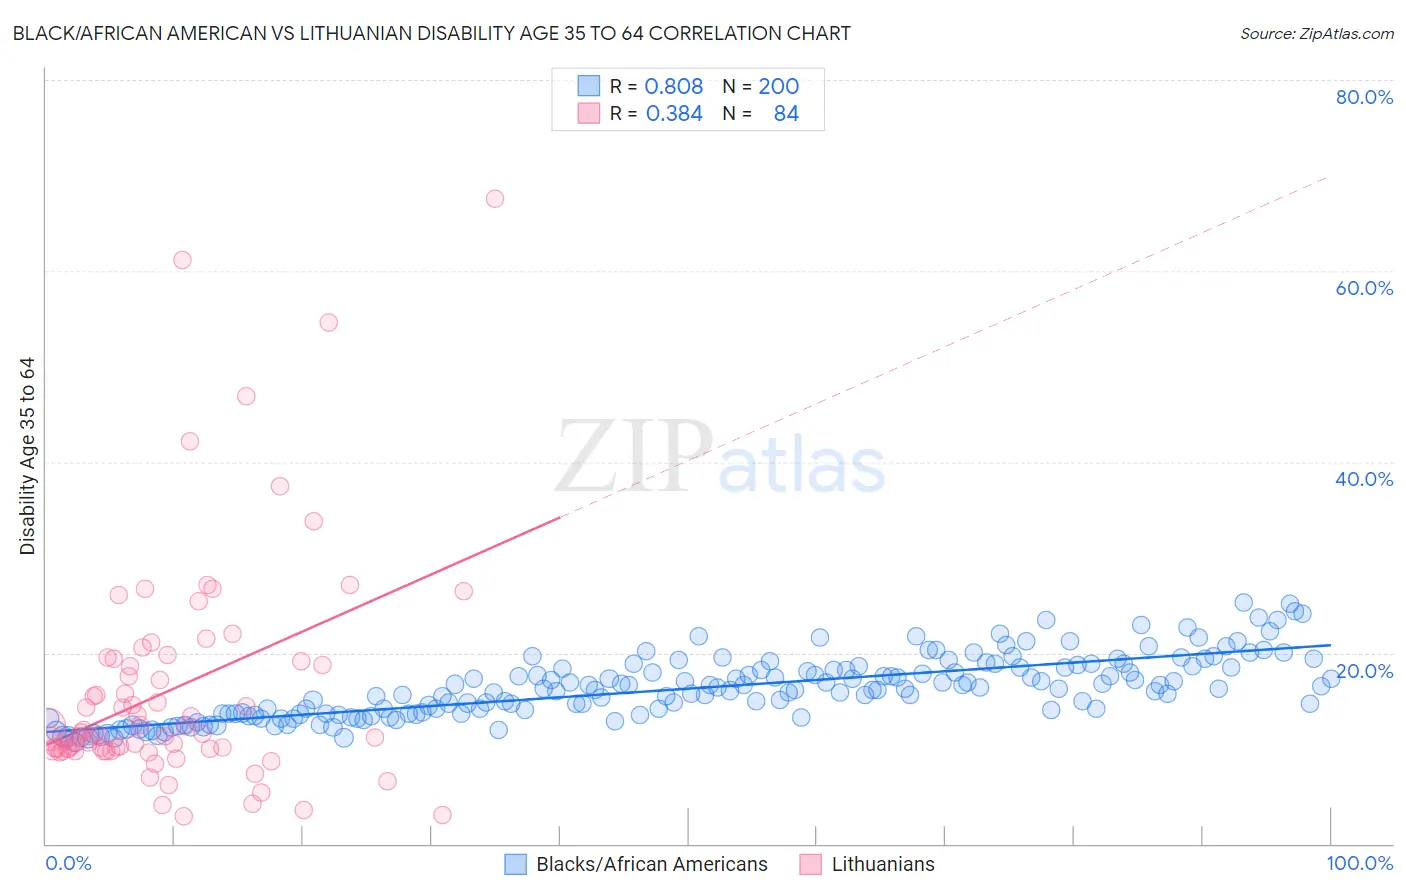
Black/African American vs Lithuanian Disability Age 35 to 64 Correlation Chart
The statistical analysis conducted on geographies consisting of 565,040,729 people shows a very strong positive correlation between the proportion of Blacks/African Americans and percentage of population with a disability between the ages 34 and 64 in the United States with a correlation coefficient (R) of 0.808 and weighted average of 14.7%. Similarly, the statistical analysis conducted on geographies consisting of 421,646,297 people shows a mild positive correlation between the proportion of Lithuanians and percentage of population with a disability between the ages 34 and 64 in the United States with a correlation coefficient (R) of 0.384 and weighted average of 10.8%, a difference of 36.1%.
Disability Age 35 to 64 Correlation Summary
| Measurement | Black/African American | Lithuanian |
| Minimum | 10.7% | 2.9% |
| Maximum | 25.3% | 67.6% |
| Range | 14.7% | 64.7% |
| Mean | 16.3% | 16.1% |
| Median | 16.1% | 11.5% |
| Interquartile 25% (IQ1) | 13.6% | 9.9% |
| Interquartile 75% (IQ3) | 18.4% | 19.2% |
| Interquartile Range (IQR) | 4.8% | 9.3% |
| Standard Deviation (Sample) | 3.3% | 12.0% |
| Standard Deviation (Population) | 3.3% | 12.0% |
Similar Demographics by Disability Age 35 to 64
Demographics Similar to Blacks/African Americans by Disability Age 35 to 64
In terms of disability age 35 to 64, the demographic groups most similar to Blacks/African Americans are Immigrants from Cabo Verde (14.7%, a difference of 0.15%), Comanche (14.7%, a difference of 0.26%), Potawatomi (14.8%, a difference of 0.30%), Ottawa (14.6%, a difference of 0.57%), and Crow (14.6%, a difference of 0.64%).
| Demographics | Rating | Rank | Disability Age 35 to 64 |
| Iroquois | 0.0 /100 | #313 | Tragic 14.4% |
| Shoshone | 0.0 /100 | #314 | Tragic 14.5% |
| Alaska Natives | 0.0 /100 | #315 | Tragic 14.5% |
| Osage | 0.0 /100 | #316 | Tragic 14.5% |
| Crow | 0.0 /100 | #317 | Tragic 14.6% |
| Ottawa | 0.0 /100 | #318 | Tragic 14.6% |
| Immigrants | Cabo Verde | 0.0 /100 | #319 | Tragic 14.7% |
| Blacks/African Americans | 0.0 /100 | #320 | Tragic 14.7% |
| Comanche | 0.0 /100 | #321 | Tragic 14.7% |
| Potawatomi | 0.0 /100 | #322 | Tragic 14.8% |
| Apache | 0.0 /100 | #323 | Tragic 14.9% |
| Chippewa | 0.0 /100 | #324 | Tragic 15.0% |
| Arapaho | 0.0 /100 | #325 | Tragic 15.1% |
| Natives/Alaskans | 0.0 /100 | #326 | Tragic 15.3% |
| Pueblo | 0.0 /100 | #327 | Tragic 15.3% |
Demographics Similar to Lithuanians by Disability Age 35 to 64
In terms of disability age 35 to 64, the demographic groups most similar to Lithuanians are Sierra Leonean (10.8%, a difference of 0.21%), Immigrants from Saudi Arabia (10.8%, a difference of 0.43%), Australian (10.8%, a difference of 0.46%), Immigrants from Bangladesh (10.9%, a difference of 0.58%), and Immigrants from Scotland (10.7%, a difference of 0.59%).
| Demographics | Rating | Rank | Disability Age 35 to 64 |
| Immigrants | Costa Rica | 91.7 /100 | #137 | Exceptional 10.7% |
| Immigrants | Southern Europe | 91.5 /100 | #138 | Exceptional 10.7% |
| Costa Ricans | 91.4 /100 | #139 | Exceptional 10.7% |
| Immigrants | Scotland | 91.3 /100 | #140 | Exceptional 10.7% |
| Australians | 90.7 /100 | #141 | Exceptional 10.8% |
| Immigrants | Saudi Arabia | 90.6 /100 | #142 | Exceptional 10.8% |
| Sierra Leoneans | 89.7 /100 | #143 | Excellent 10.8% |
| Lithuanians | 88.7 /100 | #144 | Excellent 10.8% |
| Immigrants | Bangladesh | 85.6 /100 | #145 | Excellent 10.9% |
| South American Indians | 83.5 /100 | #146 | Excellent 10.9% |
| Immigrants | Eritrea | 83.4 /100 | #147 | Excellent 10.9% |
| Arabs | 82.7 /100 | #148 | Excellent 10.9% |
| Immigrants | Cameroon | 81.1 /100 | #149 | Excellent 10.9% |
| Syrians | 79.8 /100 | #150 | Good 11.0% |
| New Zealanders | 79.3 /100 | #151 | Good 11.0% |