Estonian vs Immigrants from Netherlands Average Family Size
COMPARE
Estonian
Immigrants from Netherlands
Average Family Size
Average Family Size Comparison
Estonians
Immigrants from Netherlands
3.10
AVERAGE FAMILY SIZE
0.0/ 100
METRIC RATING
333rd/ 347
METRIC RANK
3.14
AVERAGE FAMILY SIZE
0.3/ 100
METRIC RATING
286th/ 347
METRIC RANK
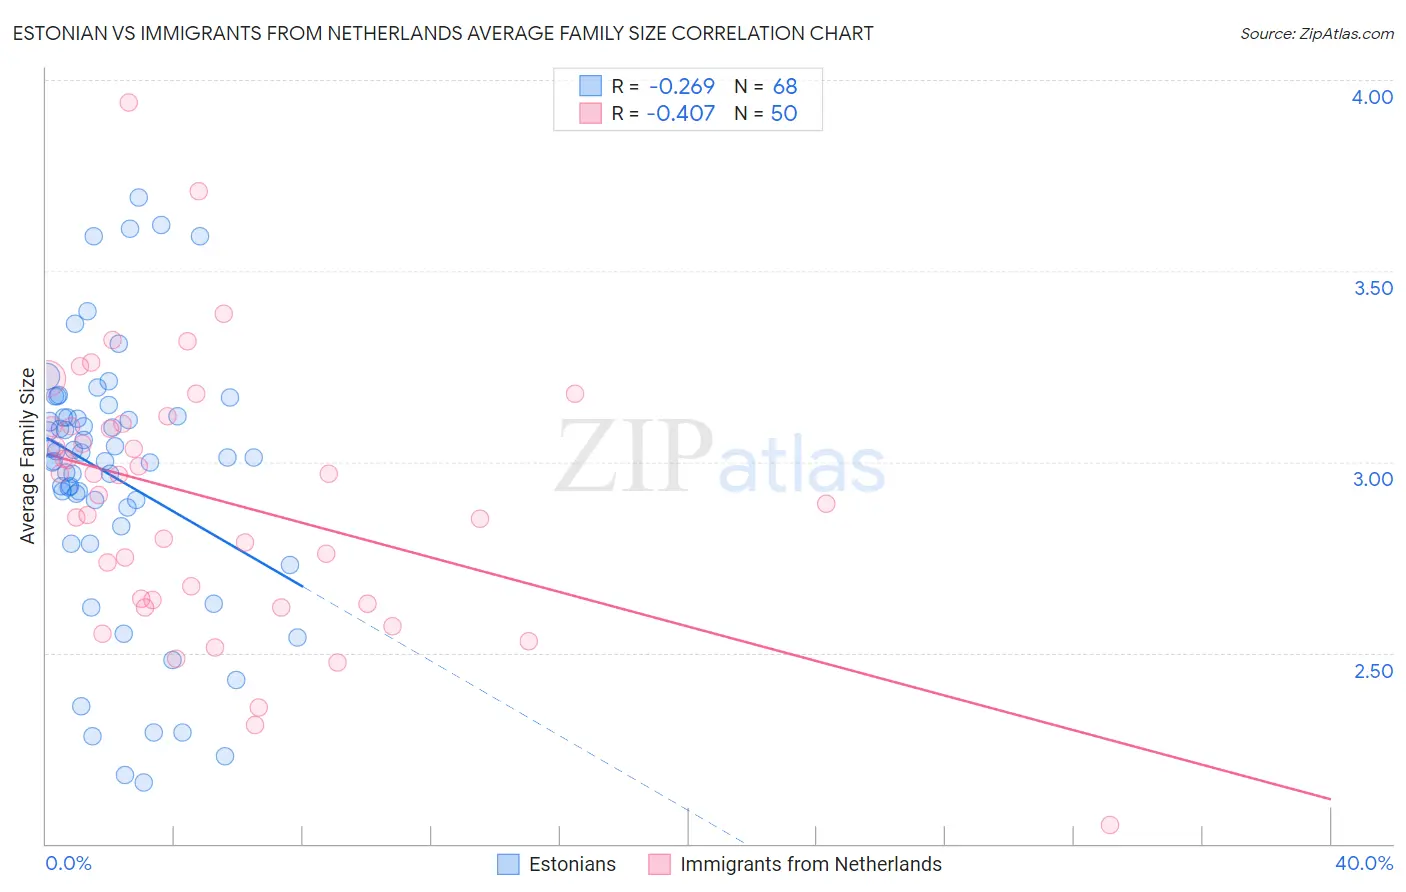
Estonian vs Immigrants from Netherlands Average Family Size Correlation Chart
The statistical analysis conducted on geographies consisting of 123,500,786 people shows a weak negative correlation between the proportion of Estonians and average family size in the United States with a correlation coefficient (R) of -0.269 and weighted average of 3.10. Similarly, the statistical analysis conducted on geographies consisting of 237,802,006 people shows a moderate negative correlation between the proportion of Immigrants from Netherlands and average family size in the United States with a correlation coefficient (R) of -0.407 and weighted average of 3.14, a difference of 1.3%.
Average Family Size Correlation Summary
| Measurement | Estonian | Immigrants from Netherlands |
| Minimum | 2.16 | 2.05 |
| Maximum | 3.69 | 3.94 |
| Range | 1.53 | 1.89 |
| Mean | 2.96 | 2.90 |
| Median | 3.01 | 2.94 |
| Interquartile 25% (IQ1) | 2.85 | 2.64 |
| Interquartile 75% (IQ3) | 3.12 | 3.09 |
| Interquartile Range (IQR) | 0.26 | 0.46 |
| Standard Deviation (Sample) | 0.35 | 0.35 |
| Standard Deviation (Population) | 0.34 | 0.34 |
Similar Demographics by Average Family Size
Demographics Similar to Estonians by Average Family Size
In terms of average family size, the demographic groups most similar to Estonians are Lithuanian (3.10, a difference of 0.0%), Luxembourger (3.10, a difference of 0.030%), Latvian (3.11, a difference of 0.050%), Scotch-Irish (3.11, a difference of 0.050%), and Scottish (3.11, a difference of 0.050%).
| Demographics | Rating | Rank | Average Family Size |
| Ottawa | 0.0 /100 | #326 | Tragic 3.11 |
| Dutch | 0.0 /100 | #327 | Tragic 3.11 |
| Czechs | 0.0 /100 | #328 | Tragic 3.11 |
| Belgians | 0.0 /100 | #329 | Tragic 3.11 |
| Latvians | 0.0 /100 | #330 | Tragic 3.11 |
| Scotch-Irish | 0.0 /100 | #331 | Tragic 3.11 |
| Scottish | 0.0 /100 | #332 | Tragic 3.11 |
| Estonians | 0.0 /100 | #333 | Tragic 3.10 |
| Lithuanians | 0.0 /100 | #334 | Tragic 3.10 |
| Luxembourgers | 0.0 /100 | #335 | Tragic 3.10 |
| Irish | 0.0 /100 | #336 | Tragic 3.10 |
| Swedes | 0.0 /100 | #337 | Tragic 3.10 |
| French | 0.0 /100 | #338 | Tragic 3.10 |
| Croatians | 0.0 /100 | #339 | Tragic 3.10 |
| Finns | 0.0 /100 | #340 | Tragic 3.09 |
Demographics Similar to Immigrants from Netherlands by Average Family Size
In terms of average family size, the demographic groups most similar to Immigrants from Netherlands are Greek (3.14, a difference of 0.010%), Immigrants from Czechoslovakia (3.14, a difference of 0.010%), Immigrants from Norway (3.14, a difference of 0.010%), Cypriot (3.14, a difference of 0.040%), and White/Caucasian (3.14, a difference of 0.050%).
| Demographics | Rating | Rank | Average Family Size |
| Immigrants | Europe | 0.5 /100 | #279 | Tragic 3.15 |
| Immigrants | England | 0.4 /100 | #280 | Tragic 3.15 |
| Immigrants | Denmark | 0.4 /100 | #281 | Tragic 3.15 |
| Yugoslavians | 0.4 /100 | #282 | Tragic 3.15 |
| German Russians | 0.4 /100 | #283 | Tragic 3.15 |
| Immigrants | France | 0.4 /100 | #284 | Tragic 3.15 |
| Whites/Caucasians | 0.3 /100 | #285 | Tragic 3.14 |
| Immigrants | Netherlands | 0.3 /100 | #286 | Tragic 3.14 |
| Greeks | 0.3 /100 | #287 | Tragic 3.14 |
| Immigrants | Czechoslovakia | 0.3 /100 | #288 | Tragic 3.14 |
| Immigrants | Norway | 0.3 /100 | #289 | Tragic 3.14 |
| Cypriots | 0.3 /100 | #290 | Tragic 3.14 |
| Alsatians | 0.2 /100 | #291 | Tragic 3.14 |
| Europeans | 0.2 /100 | #292 | Tragic 3.14 |
| Scandinavians | 0.2 /100 | #293 | Tragic 3.14 |